 Volume
4, Number 3, 2017, 153–173 journal homepage:
region.ersa.org
Volume
4, Number 3, 2017, 153–173 journal homepage:
region.ersa.orgDOI: 10.18335/region.v4i3.145
Regional Spanish Tourism Competitiveness
1 University of Las Palmas de Gran Canaria, Las Palmas, Spain Received: 21 July 2016/Accepted: 18 May 2017Abstract. The aim of this paper is to analyse the regional tourist competitiveness performance in Spain. We use the seven pillars of tourism from a very detailed and complete database carried out by the Spanish Government – MoniTUR 2010 as primary data. Thus, we calculate several regional tourist competitiveness indices using data envelopment analysis (DEA) to analyse the robustness of the results obtained in the ranking of the tourist competitiveness for the 17 Spanish Autonomous Communities. Our results are robust to the use of two different modelling strategies: (1) input and output variables selection; and (2) virtual and super efficiency DEA models. Madrid and La Rioja are found to be the most competitive regions; meanwhile other inland regions of Spain like Extremadura and Aragón are the least competitive. The position of each of the laggard Autonomous Communities should be analysed by their respective destination management organizations (DMOs) in order to envisage adequate corrective measures.
Key words: DEA; Regional tourist competitiveness; Destination management organizations; MoniTUR; Virtual Efficiency
1 Introduction
Tourism has become today one of the largest and fastest-growing economic sectors worldwide. It is an important driver of socio-economic progress as it stimulates economies and leads to the creation of jobs, incomes, investments and exports. Despite the obstacles faced during the impact of the unprecedented financial and economic crisis that hit the world in 2008, the sector has proven to be a consolidated industry which still maintains high levels of activity and has contributed to economic recovery. In 2014, tourism was responsible for generating a significant 9% world GDP (including direct, indirect and induced effect). International tourist arrivals worldwide reached 1,138 million in 2014, 51 million more than in 2013, and the UNWTO forecasts a growth between 3% and 4% in 2015 (UNWTO 2015). Despite the fall in the tourism activity in 2008 and 2009 due to the destructive effects of the financial crisis, Spanish tourism has proven to recover successfully from this observed unprecedented drawback. Spain attracted in the year 2014 for the first time in history a peak of 65.2 million international tourists, getting positioned as the third world’s top tourist destination in international tourist arrivals and the second in international tourism receipts. In addition, the country ranked first among 141 countries in the Travel & Tourism Competitiveness Index 2015 published by the World Economic Forum. In fact, tourism is one of the main economic driving forces in the country, contributing directly 10.9% GDP, generating 12% of jobs and covering 276% of trade deficit (Ministerio de Industria, Energía y Turismo 2015). The most significant tourist segment in the country is sun and sand mass tourism. Cities and municipalities along the Mediterranean coast and the Balearics and the Canary Islands stand out as some of the world’s sun and beach most favourite tourist destinations.
In order to be competitive, tourist destinations must persuade their potential tourists that they will obtain more benefit visiting their destination than any other else (Crouch 2011). Destination marketing plays a determinant role in this regard, assisting visitors with pre-visit information and after-arrival additional information; coordinating many constituent tourist sector elements; creating specific tourism planning laws; or helping to ensure the attractiveness of a set of events, programs and tourism facilities, among others. Nevertheless, when competences in tourism in a certain country are decentralized, regional governments cannot confer the same effort to tourism planning since the priorities and strategies for tourism might not be concordant. This is usually caused by the intrinsic and differential characteristics of territories. Thus, a regional analysis on tourist competitiveness within the Spanish territory is paramount in order to develop adequate destination marketing plans that enhance the image of the tourist Spanish brand.
Despite the favourable results of Spanish tourism, improvements in competitiveness from the regional perspective are needed in order to enhance the competitive position of the whole country and ensure a sustainable growth (Exceltur 2011b). Spain is divided into 17 regions at level II of the Nomenclature of Territorial Units for Statistics (referred as NUTS by the French acronym). These regions, also named Autonomous Communities, have regional governments that share governance with the Spanish central administration within their respective territories. In the field of tourism, the exclusive competence corresponds to the Autonomous Communities, so the medium and long term regional tourist competitive success depend largely on the regional tourist policies. Differences in tourist competitiveness among Spanish regions exist, mainly due to the existence of different territorial natural endowments. This dissimilarity makes the measurement and comparison of regional tourist competitiveness a complex and difficult task. Exceltur (2011b) reveals the existence of these differences on the base of climatic, scenic, cultural and sociodemographic characteristics that difficult the regional comparisons.
In this sense, the development of measurement techniques to benchmark regional tourist competitiveness becomes essential to boost the evolution of policies and private and public strategies that facilitate a differential gradual tourist repositioning. Alonso (2010) considers that the evaluation of competitiveness is a key aspect that allows destinations to facilitate, control and judge policies and strategies that quest for continuous improvements. The present research addresses this issue through the construction of a synthetic index to assess tourist competitiveness among the 17 Autonomous Communities in Spain. According to Cracolici et al. (2008), tourist areas endeavour to exploit their locational attractiveness by a smart use of input factors. Through Data Envelopment Analysis (DEA) methodology, multiple inputs and multiple outputs are combined to model multidimensional relationships among different regional competitiveness dimensions, and to compute several synthetic indices that measure the Spanish regional tourist competitiveness. Dealing with the seven tourism competitiveness pillars of MoniTUR 2010 report (Exceltur 2011b), the proposed approach uses DEA as a tool for multiple criteria decision making (MCDM). A further analysis of the robustness of the results obtained by different DEA methods is made and, furthermore, the paper will also analyse the potential differences observed among the Spanish regions highlighting the laggard regions.
The remainder of the paper is organized as follows: Section 2 offers some insights from the literature, section 3 describes the data section, section 4 details the methodology, section 5 presents and discusses the results, and finally section 6 offers some concluding remarks.
2 Literature review
The success of tourism destinations in world markets is determined by their competitiveness compared with other destination options (Dwyer et al. 2000). The concept of destination competitiveness can appear to be simple and easily understandable – it is the expression of qualitative and quantitative superiority of a territory over actual and potential competitors. Nevertheless, the complexity of the concept becomes apparent when we attempt not only to define it, but also to measure it. Numerous researchers have studied the concept of destination competitiveness, their models and determinants (Scott, Lodge 1985, Crouch, Ritchie 1999, Newall 1992, OECD 1994, Dwyer, Kim 2003, Dwyer et al. 2004, Enright, Newton 2004).
Enright, Newton (2004, p. 778) state that “a destination is competitive if it can attract and satisfy potential tourists and this competitiveness is determined both by tourism-specific factors and by a much wider range of factors that influence the tourism service providers”. Similarly, Ritchie, Crouch (2003, p. 2), detailed that “what makes a tourism destination truly competitive is its ability to increase tourism expenditure, to increasingly attract visitors, while providing them with satisfying, memorable experiences, and to do so in a profitable way, while enhancing the well-being of destination residents and preserving the natural capital of the destination for future generations”. These authors have developed since 1990s an extensive framework that has served as key reference for tourism destination management (Crouch, Ritchie 1994, 1995, 1999, 2005, Ritchie, Crouch 1993, 2000a,b, 2003, Crouch 2011). Their proposed model has as principal strength their capability to integrate all the significant factors that might symbolize destination’s tourism competitiveness. They determine in their study that the attributes explaining destination competitiveness can be gathered into four major groups: (1) Core Resources and Attractors (physiography, culture and history, market ties, mix of activities, special events, entertainment and superstructure); (2) Supporting Factors and Resources (infrastructure, accessibility, facilitating resources, hospitality, enterprise); (3) Destination Management (resources stewardship, marketing, finance and venture capital, organization, human resource development, information/research, quality of service, visitor management); and (4) Qualifying Determinants (location, interdependencies, safety/security, awareness/image/brand, cost/value) and Destination Policy, Planning and Development. Crouch (2011) analysed the impact and magnitude of these factors affecting destination competitiveness, remarking that the Core Resources and Attractors were the most relevant. The weights of the factors and sub factors were also estimated in Crouch’s study, finding that Accessibility, Physiography and Climate, Positioning/Branding, Quality of Service/Experience and Safety and Security were the most significant sub factors.
The research interest for tourism destination competitiveness that emerged in the 1990s also raised concerns for measuring it. There have been a growing number of studies that measure and assess destination competitiveness, and several evaluation methods have been reported like composite indicators based on linear aggregation models or other MCDM methods like DEA or TOPSIS (The Technique for Order of Preference by Similarity to Ideal Solution). Destination competitiveness can be assessed by using both quantitative and qualitative data. The use of hard data, such as income from tourism tourist arrivals, makes possible the quantitative evaluation of destination competitiveness performance. As Kozak, Rimmington (1999) state, qualitative performance of a destination is also useful, as it ultimately drives quantitative performance. These authors measure tourist destination competitiveness for international tourist destinations by using both quantitative and qualitative approaches. In fact, Jick (1979) advocates that both methods are complements instead of substitutes. Similarly, Mendola, Volo (2017) analyze ten of the most relevant papers on the tourism destination competitiveness (TDC) topic, admitting that qualitative performance measurement would rightfully complement quantitative measures to provide guidance in tourism policy making. However, the authors do not provide a protocol or good guidelines about how to proceed with this interesting idea, and to our knowledge, most of the papers are quantitative in nature although sometimes the databases contain some qualitative or soft data.
Regarding the unit of analysis for the destinations, it can be said that there are indeed different geographical references analysing tourist competitiveness at both regional/sub regional and national levels. For example, Kayar, Kozak (2010) measure destination competitiveness for 28 European countries applying the Travel & Tourism Competitiveness Index 2007 (TTCI). There exists also a balanced presence in literature of works in which Gooroochurn, Sugiyarto (2005) compute an aggregate index using confirmatory factor analysis to measure tourism competitiveness for over 200 countries. Dwyer, Kim (2003) built the Competitive Indicators of a Destination (CID) in order to determine the essential factors for the competitiveness of a destination. They determined the following elements: resource endowments (natural and cultural or heritage); resources created (tourist facilities, activities offered, etc.); support factors (general infrastructure, service quality, or accessibility of the destination); and destination management elements. The monitoring report on the relative tourist competitiveness of Spanish Autonomous Communities (MoniTUR) on its 2010 edition (Exceltur 2011b) analyzes their competitive and relative tourist position. It is composed by seven tourist competitive pillars, with 30 crucial areas of competitiveness and 79 final indicators. More detailed explanation of MoniTUR index may be found in the next section.
At regional and sub regional levels, Zhang et al. (2011) evaluate tourism destination competitiveness using TOPSIS and information entropy for sixteen cities in the Yangtze River Delta. The present study follows the theoretical and statistical approach of those of Cracolici, Nijkamp (2006), Cracolici et al. (2008) and Cracolici, Nijkamp (2009). These works employ DEA method in order to assess tourism competitiveness by analyzing the destination efficiency of Italian regions. Benito et al. (2014) also study the determinants of Spanish regions’ tourism performance using DEA. At national level, Huang, Peng (2012) assess the competitiveness of tourism industries in nine Asian countries using Fuzzy Rasch model and TOPSIS. Abad, Kongmanwatana (2015) use DEA, super-efficiency DEA and the non-radial Nerlove-Luenberger super-efficiency DEA to compare the destination competitiveness ranking among 27 large and small countries in the European Union. Webster, Ivanov (2014) measure using a cross-section analysis the impact of competitiveness on tourism’s contribution to economic growth for 131 countries.
3 MoniTUR and data
3.1 Monitoring report on the relative tourist competitiveness of Spanish Autonomous Communities (MoniTUR)
MoniTUR (Exceltur 2010, 2011b) is an index that measures the tourist relative competitiveness position of the 17 NUTS II (Autonomous Communities) in Spain. It is created by Exceltur in collaboration with Deloitte. Exceltur is a non-profit association formed by 25 of the most important companies throughout the Spanish tourism value chain and subsectors of central air, rail, sea and land transportation, lodging, travel agencies and tour operators, payment, car rental, tourist hospitals and bookings / GDS. Since 2002, these group leaders and heads of the Spanish tourism companies joined to promote a greater socio-economic recognition of what tourism, as a principal sector of Spanish economy, provides and represents and to contribute to achieve higher levels of competitiveness that consolidate a sustainable and rentable leadership and growth of tourism activity in Spain. According to Exceltur (2011b), tourism in Spain has still to face numerous challenges and opportunities with different accents and intensities according to the different Autonomous Communities. In this sense, MoniTUR 2010 is built as a benchmark to boost policy recommendations and private and public strategies in order to facilitate a gradual and differential tourist repositioning of global competitiveness and to rigorously identify the competitive risks and opportunities of each Spanish region.
MoniTUR 2010 (Exceltur 2011b) is the second and last published edition. It incorporates new areas, indicators and more accurate sources of information with respect to the previous MoniTUR 2009 edition. The MoniTUR 2010 report reveals the existence of four groups of Autonomous Communities that share structural similitudes. The first group is composed of the Community of Madrid, País Vasco and Catalonia, all with a high level of income and economic activity. A second group is distinguished by a higher specialization on littoral tourism, in which the Communities of Andalusia, the Canaries, the Balearics and Valencian Community, respectively, stand out. In fact, Catalonia, the Canaries, Balearics and Andalusia are, respectively, the main tourist Autonomous Communities. Together, they attracted 74.1% tourists who visited the country last year. The third group is comprised by mostly inland communities: Navarra, La Rioja, Castile-La Mancha and Castile-and-León, together with Galicia which has coastline. Finally, a fourth group is comprised by three single-province Autonomous Communities: Murcia, Asturias and Cantabria, as well as Aragón and Extremadura which have more than one province. All of them are conditioned by a lagging tourist starting position, either by minor enhancement of their range of resources and attractions, their accessibility to markets, smaller business sector, or for their still incipient tourist planning and investments.
MoniTUR 2010 analyses 7 pillars of tourist competitiveness. The seven pillars analyses 30 determinant areas of competitiveness, which in turn are divided into 79 indicators. Table A.1 (in the appendix) shows the pillars, crucial areas for competitiveness, indicators and sub indicators that form the global index. Pillars and determinant areas are equally weighted in the index. The report identifies the competitive advantages and disadvantages for each region aggregating indicators and pillars using averages that obtain the global MoniTUR ranking (Table 1). It can be seen that the communities of Madrid, Basque Country, Catalonia, Andalusia and the Canaries were positioned as the top Autonomous Communities, respectively. The communities of Extremadura, Aragon, Cantabria, Murcia and Asturias were at the bottom of the ranking.
| Autonomous Community | Ranking | Index. Average=100 | ||
| Community of Madrid | 1 | 114.2 | ||
| Basque country | 2 | 113.3 | ||
| Catalonia | 3 | 112.7 | ||
| Andalusia | 4 | 106.8 | ||
| The Canaries | 5 | 103.3 | ||
| The Balearics | 6 | 101.8 | ||
| Valencian Community | 7 | 101.4 | ||
| Galicia | 8 | 98.9 | ||
| Navarre | 9 | 98.8 | ||
| La Rioja | 10 | 98.7 | ||
| Castile-La Mancha | 11 | 97.8 | ||
| Castile and Leon | 12 | 97.5 | ||
| Asturias | 13 | 93.1 | ||
| Murcia | 14 | 93.0 | ||
| Cantabria | 15 | 92.1 | ||
| Aragon | 16 | 91.1 | ||
| Extremadura | 17 | 87.5 | ||
3.2 Data
The present study aims to analyse the tourism competitive position of Spanish NUTS II regions in Spain by composing a synthetic composite index. Data have been obtained from the MoniTUR report on its 2010 edition. MoniTUR 2010 obtained quantitative data from databases of both, public institutions, such as The National Institute of Statistics (INE), Turespaña or the Instititute of Tourism Studies (IET), and from private associations, institutes and institutions, such as Google, La Caixa, Michelin guide or the Institute of Tourism Quality of Spain. In-depth information about data resources can be found at MoniTUR 2010 annexes (Exceltur 2011a).
In the present study, the 7 pillars were chosen to be the variables used to analyse regional Spanish competitiveness. A more disaggregated analysis was discarded as the number of units is too small. The variables correspond to the average aggregation of indicators characterising each pillar. Different methods based on the selection of input and output variables as well as DEA methods will be calculated in order to evaluate the robustness of the obtained synthetic competitiveness indicators. We will compare the results of two approaches according to the consideration of variables as follows: (1) three input variables and four output variables; and (2) one fixed input variable and the seven pillars used as output variables1 . For the first scenario, the first three pillars were linearly transformed to become inputs. In this way, unfavourable factors or inputs are formed by ‘vision of strategic marketing and commercial support’, ‘transport accessibility and connectivity’ and ‘tourist competitive regulation and other conditions’. Conversely, the variables ‘structuring and diversification of tourist products’, ‘talent attraction, training and efficiency of human resources’, ‘political priority and tourism governance’ and ‘performance: social and economic outcomes’ constitute our set of positive factors.
| Variables/pillars | Mean | SD | Min | Region | Max | Region |
| Positive factors | ||||||
| Structuring and | ||||||
| diversification of tourist | 99.83 | 14.12 | 83.38 | Cantabria | 141.74 | Catalonia |
| products | ||||||
| Talent attraction, | ||||||
| training and efficiency | 100.40 | 16.07 | 75.99 | the Canaries | 143.08 | Basque Country |
| of human resources | ||||||
| Political priority and | ||||||
| tourism governance | 99.86 | 8.91 | 87.17 | Cantabria | 116.46 | La Rioja |
| Performance: social and | ||||||
| economic outcomes | 99.92 | 15.41 | 81.87 | Cantabria | 127.33 | the Canaries |
| Unfavourable factors | ||||||
| Vision of strategic | ||||||
| marketing and | 100.94 | 9.17 | 83.50 | Andalusia | 115.60 | Extremadura |
| commercial support | ||||||
| Transport accessibility | ||||||
| and connectivity | 99.23 | 17.12 | 52.15 | Madrid | 120.28 | Extremadura |
| Tourist competitive | ||||||
| regulation and other | 101.29 | 8.93 | 84.27 | La Rioja | 114.33 | Murcia |
| conditions | ||||||
Table 2 details the descriptive statistics of all the pillars included in the different models according to the original values that can be regarded as outputs (second scenario). It should be noted that with the transformation into inputs, the variables ‘vision of strategic marketing and commercial support’, ‘transport accessibility and connectivity’ and ‘tourist competitive regulation and other conditions’ will perform better for those regions with lower values. As it can be observed, severe differences are present in the minimum and maximum values of all the pillars. Cantabria has the worst aggregated MoniTUR index in the pillars ‘structuring and diversification of tourist products’, ‘political priority and tourism governance’ and ‘performance: social and economic outcomes’. However, Catalonia is the region with the highest index value of ‘structuring and diversification of tourism products’. The Basque Country seems to be the region succeeding at major talent attraction, training and efficiency of human resources. La Rioja boasts the maximum index values for political priority and tourism governance and ‘tourist competitive regulation and other conditions’. In addition, the Canaries are noted for its performance of social and economic outcomes, despite that it is the region with the minimum value on ‘talent attraction, training and efficiency of human resources’. This is an important drawback that should be corrected in the near future if the region wants to remain competitive because, as Assaf, Josiassen (2011) contend, ‘it became clear during our interviews that the service level that tourists perceive is an important determinant. Some tourists simply would not even consider visiting a country that they perceive as having a poor level of service mindedness. The tourism industry is a perfect context for the consideration of skills in services (p. 391).’ The highlights of Madrid and Andalusia are ‘transport and accessibility and connectivity’ and ‘vision of strategic marketing and commercial support’, respectively. Contrarily, Extremadura exhibits, with great differences, the minimum values on these pillars. Finally, Murcia is the region with the worst performance on ‘tourist competitive regulation and other conditions’.
4 Methodology
As said, our method is based on Data Envelopment Analysis (DEA). DEA was originally designed to measure the efficiency of a firm in a context of production economics. A firm is considered efficient if it produces the maximum output for a given level of input. Charnes et al. (1978) write the seminal paper that evaluates the performance of different DMUs – decision-making units. The DMUs are characterized by being empowered entities that have the capacity of decision about how to transform inputs into outputs. This was the origin of a discipline that measures the relative efficiency of each DMU when researchers have a sample of peer observations regarding the input and output quantities (Charnes, Cooper 1985). DEA is one of the most popular non-parametric methods to assess economic efficiency whose main advantage resides in that it is possible to use multiple inputs and outputs with no prior assumption about the subjacent technology between inputs and outputs. Moreover, the method can also be applied when the sample is small (Perrigot et al. 2009).
In conventional DEA, each data component is usually classified as either an input or resource or as an output or product depending on the nature of the firm under analysis. However, Ali, Seiford (1993) argue that DEA is also an interesting method in scenarios where researchers are interested in ranking units where the existence of a production function between inputs and outputs is not so obvious. The authors concur to follow a general guideline in which the input or output classification is based according to the analysis of whether it is better or not to have lower (inputs) or higher (outputs) values. It was already explained that in our case study all the pillars from MoniTUR have the consideration of outputs, but in order to analyze to what extent the results do not depend on the conversion of outputs to inputs, two scenarios are proposed.
Ali, Seiford (1993), Charnes et al. (1994), Coelli et al. (1998), Cooper et al. (2011) and Zhu (2014) are good references to cover the basic aspects of DEA models, DEA notation, formulation and geometric interpretation. Conventional DEA models can be divided in three different classes: variable returns to scale (VRS), constant returns to scale (CRS) and additive models. These models separate the DMUs into two different sets: (1) the efficient units that lie on the frontier of the envelopment surface; and (2) those who are inefficient because they show some slack when their position is compared with the obtained frontier.
The selection of a suitable DEA model that ranks the regional tourist competitiveness index in Spain is constrained by the characteristics of the available data, the sample size and the intrinsic nature of the issue under analysis. In particular, as in our case, if researchers are interested in obtaining a full rank of all the regions under analysis, then conventional DEA models might not be appropriate, and then some new refinement of DEA needs to be applied.
In DEA analysis, it is generally assumed that there are n production units to be evaluated, using amounts of m different inputs to produce quantities of s different outputs. Specifically, the oth production unit consumes xio units of input i (i = 1…m) and produces yro units of output r (r = 1…s). The oth production unit can now be described more compactly with the vector (Xo,Y o), which denote, respectively, the vectors of input and output values for DMUo.
Next, it is necessary to determine a potential set of possible dominant or non-dominant comparisons for each production unit considered in the analysis. DEA usually considers the dominance of all the possible linear combinations of the n DMUs, i.e. (∑ kλkXk,∑ kλkY k), with the scalar restricted to be non-negative2 . The production unit o is dominated, in terms of inputs, if at least one linear combination of production units shows that some input can be decreased without making the rest of inputs and outputs worse off. If at least one linear combination of production units shows that some output can be increased without negatively affecting the rest of inputs and outputs3 , it is dominated in terms of outputs.
In our case, policy makers and DMO managers can affect the regional tourist competitiveness by planning and implementing policies that improve the performance for some of the indicators and sub indicators included in the MoniTUR. For example, it would not be difficult to implement a policy that increases the tourist product diversification contemplating and including more tourist segments. In this paper, and given the nature of the issue under analysis, the robustness of the results is going to be based on different DEA methods based on: (1) virtual constant and variable returns to scale with an output orientation model; and (2) super-efficiency DEA model.
Formally, the multiplier-DEA CRS output efficiency for the unit o is calculated through the following linear programming problem:
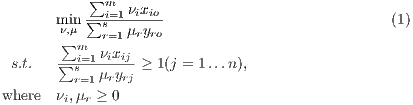
The set of constraints requires that the same weights, when applied to all the countries, do not provide any region with efficiency lower than one. The solution to this minimization problem is not unique. Coelli (1996) shows that if there exists a solution (ν,μ) to the above problem, then there exists an infinite number of solutions because (ϕν,ϕμ) with ϕ ≥ 0 is also a solution to the problem. For this reason, the problem is reformulated in an equivalent linear programming program as follows:
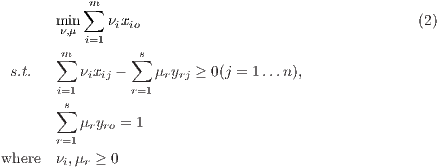
A region o is in the frontier if and only if ∑ i=1mνixio = 1 in optimality. The constraint ∑ r=1sμryro = 1 is known as a normalization constraint, and the weighted input and output are called virtual input and virtual output, respectively (Seiford, Thrall 1990). The efficiency ratio ranges from 1 to infinity, and each region under analysis obtains their optimal multipliers minimizing the self-efficiency, given the constraints.
As explained above, this method needs a major refinement as we are interested in ranking all the regions in Spain, and this is not possible for those that lie on the frontier. The discrimination power is even more acute in our case as we do not have a large sample size. For this reason, the analysis is constrained within the pillars of the database. Our database does not even satisfy the standard rule of thumb proposed by Cooper et al. (2000): n ≥ max(m×s,3(m + s)), where n is the number of DMUs, m is the number of inputs and s in the number of outputs.
Ranking DEA methods have been analyzed and proposed in previous studies. There are different techniques and proposals based on: (1) cross-efficiency DEA models (Sexton et al. 1986, Doyle, Green 1994, Adler et al. 2002); (2) super-efficiency models (Andersen, Petersen 1993, Zhu 1996, Seiford, Zhu 1998); and (3) virtual efficiency models (Bazargan, Vasigh 2003, Martín, Román 2006, 2007, Barzegarinegad et al. 2014, Martín et al. 2017).
This paper uses two different approaches based on the super-efficiency DEA models and the virtual efficiency models. Super-efficiency DEA models are based on the evaluation of a DMU when this is not included in the reference set of the envelopment models. The super-efficiency models are thus calculated using the technological frontier constructed from the rest of the DMUs included in the analysis. Super-efficiency models are also very convenient to analyze the performance of the extreme efficient units.
On the other hand, the virtual efficiency models are based on the introduction of a virtual super-efficient region in the dataset. This method discriminates all the units as there is only one efficient region (this virtual champion). The efficient frontier, based on this model, therefore consists of only this virtual super-efficient region that has been constructed ad-hoc. The ranking is justified because the same virtual unit is used for all DMUs as the reference set.
The input and output vectors for this virtual super-efficient unit are:
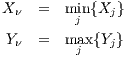
where Xν and Y ν are the input and output vectors of the virtual super-efficient unit and Xj and Y j are the input–output vectors of the jth region. In other words, the virtual region has the lowest input vector and the highest output vector of all the regions conserved in the analysis. Thus, the DEA model expressed by (2) is run with the inclusion of this new virtual unit and the efficiency scores are used to fully rank the Spanish regional tourist competitiveness. As expected by construction, the discrimination power of the method is maximum.
5 Results
| Autonomous Community | Ranking | DEA Index | ||
| Community of Madrid | 1 | 1.000 | ||
| Basque country | 3 | 1.037 | ||
| Catalonia | 6 | 1.089 | ||
| Andalusia | 5 | 1.080 | ||
| The Canaries | 7 | 1.165 | ||
| The Balearics | 12 | 1.353 | ||
| Valencian Community | 10 | 1.326 | ||
| Galicia | 4 | 1.068 | ||
| Navarre | 8 | 1.195 | ||
| La Rioja | 1 | 1.000 | ||
| Castile-La Mancha | 11 | 1.336 | ||
| Castile and Leon | 13 | 1.461 | ||
| Asturias | 9 | 1.217 | ||
| Murcia | 16 | 1.724 | ||
| Cantabria | 14 | 1.518 | ||
| Aragon | 17 | 1.732 | ||
| Extremadura | 15 | 1.635 | ||
Table 3 shows the results for the 17 Autonomous Communities of Spain under the two different scenarios considered regarding the selection of input and output variables and the three selected DEA models, the virtual efficient DEA model under constant and variable returns to scale and the super efficiency model under variable returns to scale. The first column shows the results of the virtual efficiency under constant returns to scale, and it can be seen that there are two regions that can be considered equally competitive: Madrid and La Rioja. An analysis of the table reveals that, according to this methodology, the five most competitive regions are Madrid, La Rioja, the Basque country, Galicia and Andalusia. In regard to the 5 least competitive regions (Aragon, Murcia, Extremadura, Cantabria and Castile and Leon) it can be seen that, with the exception of Murcia, the regions are not located in the Mediterranean coast.
This proposal seems to penalize some of the competitive regions according to the average figures from MoniTUR. In particular, the relative positions of the Balearic archipelago and the Valencian community shifts their ranking positions very much. The shift in position of La Rioja is also particularly relevant. According to MoniTUR, La Rioja occupies the tenth position, however, from our analysis it can now be considered one of the most competitive tourist regions in Spain with Madrid.
Looking at the tail of the distribution, it can be observed that the set of the four least competitive regions is not altered within both methods: MoniTUR and VDEA-CRS rankings. But, the relative position of the regions change. If we analyse now the ranking obtained by the model under variable returns to scale, it can be concluded that the most competitive regions in Spain are again Madrid and La Rioja, but there are now two additional communities that can be considered equally competitive: Catalonia and the Basque Country. The case of Catalonia is particularly relevant as it gains four positions in the ranking. Looking at the tail of the distribution, it can be seen that the position of the five laggard regions has changed but the set of the regions remains stable: Castile-León, Cantabria, Extremadura, Murcia and Aragón. The super-efficiency model in the first scenario that uses three pillars like inputs and the rest of the pillars as outputs is not very informative as there are six regions that belong to the set of extreme efficient units for which the linear program is unfeasible. Nevertheless, regarding the five least competitive regions, it can be observed that the set is also the same.
Analysing now the results for the second scenario, it can be seen that there is not any difference between the models based on virtual efficiency independently of what type of returns to scale is used. It is not a surprise that the most competitive regions according to these models are almost the same as those that exhibit an unfeasible solution for the first scenario under the super-efficiency model. It is less informative than other models as there are five competitive regions in Spain: Madrid, the Basque Country, Catalonia, Andalusia and La Rioja. Castile-La Mancha, Castile-León, Murcia, Aragón and Extremadura are the laggard regions in Spain with respect to tourist competitiveness. Finally, analysing the results obtained for the second scenario and the super-efficiency model, it can be seen that the model ranks all the Spanish regions, being the five most competitive: (1) Madrid; (2) Catalonia; (3) the Basque Country; (4) La Rioja; and (5) Andalusia. On the opposite side, the five least competitive regions are: (13) Castile-León; (14) Cantabria; (15) Murcia; (16) Extremadura; and (17) Aragón.
The position of Madrid is not surprising as it contains the capital city of the country, and its relative ranking in the seven pillars is always well positioned. In particular, Madrid shows the best performance in the pillar of transport accessibility and connectivity. Madrid has also the most impressive art museums in Spain, being the Prado, Reina Sofia and Thissen museums. On top of being some of the most important art museums in the world, they are located in an area where all of them can be easily reached by public transport from any neighbourhood of Madrid. Madrid has also three important World Heritage sites: El Escorial, Aranjuez and Alcalá de Henares. Ortega-Martínez, Such-Devesa (2013) find that Spanish National Tourist Organization (Turespaña) and Madrid websites that promote the tourism in Madrid do not use the denomination of World Heritage in promoting and communicating potential attractions in the community of Madrid. In the specific websites of the municipalities or even the main attractions, the World Heritage distinctive plays a more determinant role, although there are important differences between them. In 2014, the top ten visited places in Madrid were: (1) the Reina Sofia museum; (2) the Prado museum; (3) the Warner Bros Park; (4) the Amusement Park; (5) the Royal Palace; (6) the Thyssen museum; (7) the Real Madrid Santiago Bernabeu Tour; (8) the Zoo and Aquarium; (9) the lighted house; and (10) the Archaeological museum.
Another interesting result to highlight is that La Rioja shifts dramatically the position between different indices, the MoniTUR and all the indices proposed in this study. La Rioja always increases some positions from the tenth to the set of the most competitive regions in Spain. It can be seen that La Rioja shows the best performance in two out of the seven pillars: (1) the political priority and tourist governance; and (2) the tourist competitive regulation and other conditions. La Rioja is one of the inland communities in Spain that was more proactive in the past to boost tourist activities as a way to increase the value of its natural and cultural heritage (Vera, Marchena 1998, Ivars Baidal 2004). La Rioja also benefitted from the structural funds provided by the European Union, as a tool for stabilizing the rural population, that include concrete measures related to the promotion of tourism investment in rural areas through mainly agro-tourism, wine-tourism and rural tourism (Diéguez et al. 2014). In La Rioja, the importance of the protected denomination of origin (PDO) of “rioja wine” can be considered one of the most important causes that has fostered the development of wine tourism in this inland Spanish region, which has generated one of the most successful tourism products, creating important synergies with other resources such as gastronomy, monuments and cultural events (López-Guzmán, Sánchez Cañizares 2008). Cabello, Pascual Bellido (2015) contend that wine tourism has become the hallmark of the region for investments and support, both from the public and private sectors. The main Rioja wineries follow the Bordeaux wineries model, seeing in tourism a new opportunity to diversify its product, conditioning and opening not only the cellars but the vineyards to the tourist experience. The offer is enlarged with other activities such as accommodation, catering, education, training and spa, linking all of them to a broad concept of wine culture.
La Rioja competitiveness performance goes further beyond the definition provided by Ritchie, Crouch (2003, p. 2): “What makes a tourism destination truly competitive is its ability to increasingly attract visitors”. It can be seen that this definition can be mainly approximated by the seventh pillar: ‘the social and economic performance’. It is not strange that analysing the group of peers in which Extremadura should base the strategy in order to be more competitive, La Rioja plays a prominent role. In this regard, Extremadura can learn from the past experience of La Rioja in order to develop an adequate strategy with respect to other agricultural products that could become important icons for future agro-tourism development.
6 Conclusions
This paper presents a comparison of the MoniTUR index with six additional indices based on two different data scenarios and three methodological proposals, virtual efficiency with constant and variable returns to scale and super-efficiency. All these indices measure the Spanish regional tourist competitiveness for the year 2010. Our analysis is based on the seven pillars that conform the MoniTUR database. As it can be read in Exceltur (2011b), MoniTUR aims to provide an objective instrument that periodically assesses and compares the main transversal tourist competitiveness pillars among the seventeen Spanish Autonomous Communities.
Our results show that the proposed indices are quite robust regarding the sets of competitive and uncompetitive regions. It also seems that the indices based on DEA are particularly affecting the relative positions among three particular regions: the Balearic Islands, the Valencian Community and La Rioja. The two first regions are well-known tourist destinations where sun-and-sea tourism is one of the main segments that has been developed and attended. The beaches and good weather is one of the leading reasons why many tourists still spend holidays at destinations. Barros et al. (2011) and Benito et al. (2014) find that coastal regions are more competitive than inland regions using two-stage DEA models to analyse the regional tourist competitiveness in Spain and France. On the other hand, La Rioja developed a strategy to promote a greater cooperation between the private and public sector that took advantage of the wine PDO and positioned the region as the best place in Spain to enjoy an authentic experience of the culture of wine.
Our main contribution is that while MoniTUR measures tourist regional competitiveness in Spain with the average figures for the seven pillars included in the analysis, our method ranks the competitive performance using very different alternatives with pertinent robust results. It is not the purpose of this paper to elicit the best proposal but as the results are robust it can be concluded that the virtual efficiency CRS model for the first scenario and the super-efficiency model for the second scenario are two valid methods to analyse the Spanish tourist regional competitiveness. From here, this study can be used by all the main stakeholders that are part of Exceltur with a clear objective for highlighting areas for resource allocation and future investments that improve the relative regional competitiveness. Other stakeholders who can be benefitted from these results are those policy planners from the laggard regions.
On the other hand, an important venue for future research should be based on having a better understanding of the relevant attributes that determine the relative tourist regional competitiveness, with special emphasis in turning the focus of research more toward assessing the relative importance of these attributes (Crouch 2011).
Acknowledgement
This research was supported by a project “La calidad del servicio en la industria hotelera. ECO2011-23852” funded by the Ministry of Science and Innovation of the Spanish Government.
References
Abad A, Kongmanwatana P (2015) Comparison of destination competitiveness ranking in the European Union using a non-parametric approach. Tourism Economics 21[2]: 267–281. CrossRef.
Adler N, Friedman L, Sinuany-Stern Z (2002) Review of ranking methods in the data envelopment analysis context. European Journal of Operational Research 140: 249–265. CrossRef.
Ali A, Seiford LM (1993) The mathematical programming approach to efficiency analysis. In: Fried HO, Lovell CAK, Schmidt SS (eds), The Measurement of Productive Efficiency: Techniques and Applications. Oxford University Press, New York, 120–159. CrossRef.
Alonso V (2010) Factores críticos de éxito y evaluación de la competitividad de los destinos turístico. Estudios y perspectivas en turismo 19[2]: 201–220
Andersen P, Petersen NC (1993) A procedure for ranking efficient units in data envelopment analysis. Management Science 39: 1261–1294. CrossRef.
Assaf AG, Josiassen A (2011) Identifying and ranking the determinants of tourism performance: A global investigation. Journal of Travel Research 51[4]: 388–399. CrossRef.
Barros CP, Botti L, Peypoch N, Robinot E, Solonandrasana B, Assaf AG (2011) Performance of French destinations: Tourism attraction perspectives. Tourism Management 32: 141–146. CrossRef.
Barzegarinegad A, Jahanshahloo G, Rostamy-Malkhalifeh M (2014) A full ranking for decision making units using ideal and anti-ideal points in DEA. The Scientific World Journal. CrossRef.
Bazargan M, Vasigh B (2003) Size versus efficiency: A case study of US commercial airports. Journal of Air Transport Management 9: 187–193. CrossRef.
Benito B, Solana J, López P (2014) Determinants of spanish regions’ tourism performance: A two-stage, double-bootstrap data envelopment analysis. Tourism Economics 20[5]: 987–1012. CrossRef.
Cabello SA, Pascual Bellido N (2015) La construcción del turismo en nuevos destinos: luces y sombras. El caso de La Rioja (España). Nóesis. Revista de Ciencias Sociales y Humanidades 24[47-1]: 30–48. CrossRef.
Charnes A, Cooper W, Lewin AY, Seiford LM (1994) Data Envelopment Analysis. Theory, Methodology and Applications. Kluwer Academic, Boston. CrossRef.
Charnes A, Cooper WW (1985) Preface to topics in data envelopment analysis. Annals of Operations Research 2[1]: 59–94. CrossRef.
Charnes A, Cooper WW, Rhodes E (1978) Measuring the efficiency of decision making units. European Journal of Operational Research 2[6]: 429–444. CrossRef.
Coelli T (1996) A guide to DEAP version 2.1: a data envelopment analysis (computer) program. CEPA Working Paper 96/08. Centre for Efficiency and Productivity Analysis. Armidale: University of New England
Coelli T, Rao DSP, Battese GE (1998) An Introduction to Efficiency and Productivity Analysis. Kluwer Academic, Boston. CrossRef.
Cooper W, Sieford L, Tone K (2000) Data Envelopment Analysis. A Comprehensive Text with Models, Applications, Reference and DEA-Solver software. Kluwer Academic Publishers, Norwell
Cooper WW, Seiford LM, Zhu J (2011) Handbook on data envelopment analysis. Springer Science & Business Media, New York. CrossRef.
Cracolici MF, Nijkamp P (2006) Competition among tourist destination: An application of data envelopment analysis to Italian provinces. In: Giaoutzi M, Nijkamp P (eds), Tourism and Regional Development. New Pathways. Ashgate, Aldershot, England, 133–152
Cracolici MF, Nijkamp P (2009) The attractiveness and competitiveness of tourist destinations: A study of Southern Italian regions. Tourism Management 30[3]: 336–344. CrossRef.
Cracolici MF, Nijkamp P, Rietveld P (2008) Assessment of tourism competitiveness by analysing destination efficiency. Tourism Economics 14[2]: 325–342. CrossRef.
Crouch GI (2011) Destination competitiveness: An analysis of determinant attributes. Journal of Travel Research 50[1]: 27–45. CrossRef.
Crouch GI, Ritchie JRB (1994) Destination competitiveness: Exploring foundations for a long-term research program. Proceedings of the Administrative Sciences Association of Canada 1994 annual conference, Halifax, Nova Scotia, 79-88
Crouch GI, Ritchie JRB (1995) Destination competitiveness and the role of the tourism enterprise. Proceedings of the Fourth Annual World Business Congress, Istanbul, Turkey, 43-48
Crouch GI, Ritchie JRB (1999) Tourism, competitiveness, and societal prosperity. Journal of Business Research 44: 137–152. CrossRef.
Crouch GI, Ritchie JRB (2005) Application of the analytic hierarchy process to tourism choice and decision making: A review and illustration applied to destination competitiveness. Tourism Analysis 10: 17–25. CrossRef.
Diéguez MI, Sinde AI, Gueimonde A (2014) Actividad empresarial y resultados percebidos más allá de la racionalidad económica: El caso del turismo rural. PASOS. Revista de Turismo y Patrimonio Cultural 12[1]: 79–93. CrossRef.
Doyle JR, Green R (1994) Efficiency and cross-efficiency in data envelopment analysis: Derivatives, meanings and uses. Journal of the Operational Research Society 45[5]: 567–578. CrossRef.
Dwyer L, Forsyth P, Rao P (2000) The price competitiveness of travel and tourism: A comparison of 19 destinations. Tourism Management 21[1]: 9–22. CrossRef.
Dwyer L, Kim C (2003) Destination competitiveness: Determinants and indicators. Current Issues in Tourism 6[5]: 369–414. CrossRef.
Dwyer L, Mellor R, Livaic Z, Edwards D, Kim C (2004) Attributes of destination competitiveness: A factor analysis. Tourism Analysis 9[1-2]: 91–10. CrossRef.
Enright MJ, Newton J (2004) Tourism destination competitiveness: A quantitative approach. Tourism Management 25[6]: 777–788. CrossRef.
Exceltur (2010) Monitur 2009. Monitor de competitividad turística relativa de las comunidades autónomas españolas. available at http://exceltur.org/wp-content/uploads/2014/10/MONITUR-2009_INFORME.pdf. (accessed 21st December 2015)
Exceltur (2011a) Monitur 2010. anexos. available at http://exceltur.org/wp-content/uploads/2014.old/10/MONITUR-2010_ANEXOS.pdf. (accessed 20th December 2015)
Exceltur (2011b) Monitur 2010. Monitor de competitividad turística relativa de las comunidades autónomas españolas. available at http://exceltur.org/wp-content/uploads/2014.old/10/MONITUR-2010_INFORME.pdf. (accessed 20th December 2015)
Farrel MJ (1957) The measurement of productive efficiency. Journal of the Royal Statistical Society A120: 253–290. CrossRef.
Gooroochurn N, Sugiyarto G (2005) Competitiveness indicators in the travel and tourism industry. Tourism Economics 11[1]: 25–43. CrossRef.
Huang JH, Peng KH (2012) Fuzzy Rasch model in TOPSIS: A new approach for generating fuzzy numbers to assess the competitiveness of the tourism industries in Asian countries. Tourism Management 33[2]: 456–465. CrossRef.
Ivars Baidal JA (2004) Regional tourism planning in Spain: Evolution and perspectives. Annals of Tourism Research 31[2]: 313–333. CrossRef.
Jick TD (1979) Mixing qualitative and quantitative methods: Triangulation in action. Administrative science quarterly 24[4]: 602–611. CrossRef.
Kayar cH, Kozak N (2010) Measuring destination competitiveness: An application of the travel and tourism competitiveness index (2007). Journal of Hospitality Marketing & Management 19[3]: 203–216. CrossRef.
Kozak M, Rimmington M (1999) Measuring tourist destination competitiveness: Conceptual considerations and empirical findings. International Journal of Hospitality Management 18[3]: 273–283. CrossRef.
López-Guzmán TJ, Sánchez Cañizares SM (2008) La creación de productos turísticos utilizando rutas enológicas. PASOS. Revista de Turismo y Patrimonio Cultural 6[2]: 159–171. CrossRef.
Martín JC, Mendoza C, Román C (2017) A DEA travel-tourism competitiveness index. Social Indicators Research 130[3]: 937–957. CrossRef.
Martín JC, Román C (2006) A benchmarking analysis of Spanish commercial airports. A comparison between SMOP and DEA ranking methods. Networks and Spatial Economics 6[2]: 111–134. CrossRef.
Martín JC, Román C (2007) Political opportunists and mavericks? A typology of Spanish airports. International Journal of Transport Economics 34[2]: 245–269
Mendola D, Volo S (2017) Building composite indicators in tourism studies: Measurements and applications in tourism destination competitiveness. Tourism Management 59: 541–553. CrossRef.
Ministerio de Industria, Energía y Turismo (2015) Balance año turístico 2014. available at http://www.minetur.gob.es/es-es/gabineteprensa/notasprensa/2015/documents/150121dossier%20balance%20tur%C3%ADstico%202014.pdf. (accessed 3rd November 2015)
Newall JE (1992) The challenge of competitiveness. Business quarterly 56[4]: 94–100
OECD (1994) The world competitiveness report. World Economic Forum and IMD International, Lausanne, Switzerland
Ortega-Martínez E, Such-Devesa MJ (2013) Comunicación y conocimiento del patrimonio mundial de la Comunidad de Madrid. Cuadernos de turismo 31: 263–288
Perrigot R, Cliquet G, Piot-Lepetit I (2009) Plural form chain and efficiency: Insights from French hotel chains and DEA methodology. European Management Journal 27: 268–280. CrossRef.
Ritchie JRB, Crouch GI (1993) Competitiveness in international tourism: A framework for understanding and analysis. Proceedings of the 43rd Congress of the Association Internationale d’Experts Scientifique du Tourisme, San Carlos de Bariloche, Argentina, 23-71
Ritchie JRB, Crouch GI (2000a) Are destination stars born or made: Must a competitive destination have star genes? Proceedings of the 31st Annual Travel and Tourism Research Association Conference, Burbank, CA, 306-315
Ritchie JRB, Crouch GI (2000b) The competitive destination: A sustainability perspective. Tourism Management 21: 1–7
Ritchie JRB, Crouch GI (2003) The competitive destination: A sustainable tourism perspective. CABI, Wallingford. CrossRef.
Scott BR, Lodge GC (1985) U.S. competitiveness in the World Economy. Harvard Business School Press, Boston
Seiford LM, Thrall RM (1990) Recent developments in data envelopment analysis: The mathematical programming approach to frontier analysis. Journal of Econometrics 46: 7–38. CrossRef.
Seiford LM, Zhu J (1998) Stability regions for maintaining efficiency in data envelopment analysis. European Journal of Operational Research 108: 127–139. CrossRef.
Sexton TR, Silkman RH, Hogan AJ (1986) Data envelopment analysis: Critique and extensions. In: Silkman RH (ed), Measuring Efficiency: An Assessment of Data Envelopment Analysis. Jossey-Bass, San Francisco, 73–105
UNWTO – World Tourism Organization (2015) Tourism highlights. 2015 edition. available at http://www.e-unwto.org/doi/pdf/10.18111/9789284416899. (accessed 30th October 2015)
Vera F, Marchena M (1998) Efectos del turismo en las estructuras regionales periféricas. Una aproximación analítica. Millars 21: 109–144
Webster C, Ivanov S (2014) Transforming competitiveness into economic benefits: Does tourism stimulate economic growth in more competitive destinations? Tourism Management 40: 137–140. CrossRef.
Zhang H, Gu CL, Gu LW, Zhang Y (2011) The evaluation of tourism destination competitiveness by TOPSIS & information entropy – A case in the Yangtze river delta of China. Tourism Management 32[2]: 443–451. CrossRef.
Zhu J (1996) Robustness of the efficient DMUs in data envelopment analysis. European Journal of Operational Research 90: 451–460. CrossRef.
Zhu J (2014) Quantitative models for performance evaluation and benchmarking: Data envelopment analysis with spreadsheets. Springer, New York