 Volume
3, Number 1, 2016, 69–85 journal homepage:
region.ersa.org
Volume
3, Number 1, 2016, 69–85 journal homepage:
region.ersa.orgDOI: 10.18335/region.v3i1.71
Regional Energy Efficiency Programs in Russia: The Factors of Success
1 Russian Academy of Science, Moscow, Russia (email: lanarat@mail.ru)2 Russian Academy of Science, Moscow, Russia (email: ratner.p.d@gmail.com) Received: 25 February 2015/Accepted: 9 April 2016
Abstract. In this paper, we study the reasons for extremely high difference in energy intensity of the Russian regions under different methodological approaches. We compare the most popular measures of state’s energy efficiency policy in Russia with best world practices and investigate the factors of their effectiveness. We test the hypothesis that the level of development of regional innovation system determines how the regional economy reacts to the removal of market barriers to energy efficiency. Our findings reveal that in the face of rising electricity prices, regions with well-developed regional innovation systems induce technical and other kinds of innovation in the field of energy efficiency, while other regions are not able to reduce their energy intensity. The main practical implementation of the study is that market measures for improvement of energy efficiency do not work in the regions with underdeveloped innovation systems.
1 Introduction
During the last two decades, all industrially developed countries have shown a growth of attention to the matters of energy efficiency and energy saving. The convergence and diffusion of international energy efficiency policies (Busch, Jörgens 2012), mostly through the cooperation with IEA under the framework of the Joint Declaration signed in July 1994 (IEA 2002) and commercial and demonstration activities of international companies (Martinot 1998) has led to development of multiple laws and government programs in Russia during 1995-1998 for energy saving and increasing the energy efficiency (EE) of the national economy. However, the initial indicators for the process of realization of the state policy have been very low compared to other countries (IEA 2006). The Russian energy system was in a bad state due to the lack of investment and predatory exploitation of accumulated technological and material resources in previous years. Russian industry had inherited a very power-consuming structure from the USSR (Fromme 1996). The decrease of production during the nineties has also affected the energy efficiency of the economy negatively (Bashmakov, Myshak 2014). Due to these reasons, first versions of Russian EE policies had used such instruments as direct subsidies to the companies in the fuel and energy complex and energy-intensive industry branches, but did not affect other sectors of economy and households.
Since the year 2000, Russia’s energy efficiency has achieved much more promotion compared to that of the previous decades (Zhang 2011). However, the main period of implementation of various EE programs and projects has matched with the period of recovering economic growth in Russia after the decrease of industrial production by some 40% in 1991–1999. Therefore, evaluating the success of implementation of the governmental efforts for increasing energy efficiency and the factors of this success (or failure) is non-trivial.
An important fact is that in the middle of past decade the focus of Russian EE policy has moved from federal to regional level due to the fundamental differences in nature, climate conditions, and power supply of the fuel and energy balance of macro-regions of the country. Russian regions have developed their own EE policies that together with above-mentioned fundamental factors have led to a significant difference in energy intensity of regional GDPs. A vast literature basis in Russian addressed the issue of the quality of regional energy management (Volkova et al. 2012). However, a closer look on the problem reveals that neither heterogeneous climate and infrastructural conditions, nor the quality of regional management can be a comprehensive explanation of extremely high differences in energy intensity of regional economic systems (Ratner 2014).
The goal of this paper is the investigation of factors that affect the success of implementation of various state EE programs and measures. Under the framework of extensive energy-efficiency gap methodology (Backlund et al. 2012) we study different barriers for energy efficiency. The main hypothesis of the study is that the reduction of cost barriers for energy efficiency induces variegated rates of energy technology innovation in different regions mostly depending on the effectiveness of the innovation system in the relevant regions. This idea was initially formulated to explain international variation in the form of reaction to oil shocks and energy price increases (Newell 2010, Popp 2002) and then empirically tested for national innovation systems of 23 industrialized countries that joined the OECD before the year 1989 (Cheon, Johannes 2012). In our study, we test this theoretical argument on the regional level using the Russian Federal State Statistic Agency database.
The structure of the paper is as follows: Section 2 presents a brief analysis of evolution of goals, tasks, and instruments of Russian EE policies on the federal level. Sections 3 and 4 analyze various approaches and tools for realization of regional EE programs. In Section 5, using different theoretical approaches, we investigate possible causes for success and failure of regional EE programs. In Section 6, we test the main hypothesis of our study using econometric modelling. The concluding section (Section 7) of this work discusses different possibilities of practical application for our findings.
2 Russian energy efficiency policy: matching the world trend
Presently Russia is the third-largest contributor to total greenhouse gases emissions (GHG) in the world, after China and the USA. Recently launched policies of energy efficiency in the Russian Federation resulted in impressive GDP energy intensity and correspondent GHG- intensity decline over the last 15 years. Nonetheless, there is still a significant energy-efficiency gap, which refers to a number of socio-economic phenomena, well-investigated in the world literature, but not sufficiently studied in the Russian scientific community. Introduced in 1994 by American economists A. Jaffe and R. Stavins (Jaffe, Stavins 1994), this term refers to a situation in the socio-technical system, where existing technical and technological possibilities of energy efficiency (including the use of alternative sources of energy) go under-utilized despite their potential economic viability. Explanations for this situation, various in nature, commonly receive categorization as social and institutional barriers (Brown 2001, Eyre 1997, Almeida 1998, Sorrell et al. 2000, IEA 2007).
Despite the lack of theoretical works by Russian scientists dedicated to the study of energy efficiency gap there is a lot of empirical evidence of this phenomenon in the scientific literature (Fromme 1996, Korppoo 2005, Ratner, Iosifova 2014).
The outcome of EE policy efforts can be easily visible when measured by decreasing energy intensity of GDP and/or absolute decrease in the use of fuel. However, the real factors of energy intensity reduction may be latent, so the implementation of the same measures and policy instruments can provide effects in energy saving of different sizes in a variety of socio-technical systems.
It should be noted that most of the Russian state EE policies is an adaptation or a generalization of global best practices in this field, and their evolution over the period of 1995-2013 is consistent with global trends described by Tanaka (2011). Recent Russian EE policies are presented in a number of official documents of different types – state strategies, state (federal) and regional laws and state (federal) programs on energy efficiency. The main energy policy targets of Russia are presented in its Energy Strategies (ES). All three ES (of 1995, 2003 and 2009) noted the importance of EE, but in a different proportion. The basic principles and measures of energy conservation and energy efficiency policy are presented in federal laws (FL) on energy efficiency (1995, 2009). However, the provisions of these issues have been really supported only by federal programs on energy efficiency (1998, 2001, 2013). Thus, the transition of the policies’ primary purposes can be seen in ES and FL, but the real shifting in focus can be evaluated only through joint-comparative analysis of all these official papers.
A detailed analysis of the evolution of Russian EE policy shows that in the period 1995-2013 a significant shift in focus from issues of energy conservation (measured in absolute terms of energy saved) on energy efficiency (measured as the amount of energy used per unit of production) has happened in Russia as well as in most countries of the IEA (Ratner 2014). In addition, an increased attention to the problems of climate change and sustainable development can be noticed. This fact can be easily interpreted as a manifestation of the diffusion of management innovations in the field of environmental problems and energy efficiency, which has been widely investigated in numerous theoretical and empirical studies (Holzinger et al. 2008, Busch, Jörgens 2012, Schaffer, Bernauer 2014).
Another global trend – the transformation of ratio of the two main approaches in EE policies: (1) from the sectoral measures to instruments applicable in whole industries and even across the national economy and (2) maximization of social and environmental impacts of introduced incentives (Sandén, Azar 2005) – is not so obvious. Indeed, analyzing the content of federal laws and programs for evidence of replacing such sectoral measures as direct regulation and direct subsidies with more universal tools as energy taxes, taxes on greenhouse gas emissions, and organization of emissions trading, it is difficult to notice any significant change in the prevailing approach of direct subsidies.
However, if one shifts the focus of research from the federal to the regional level, the desired trend becomes observable. The legitimacy of such a shift of the focus of research is confirmed with some theoretical arguments thoroughly discussed in the next section, as well as with an analysis of the government’s report on the implementation of the Federal Program “Energy Efficient Economy” for the period 2002-2005 and up to 2010 (approved by the Russian Government in November of 2011). In 2005, the program was considered 99% fulfilled, however, despite the successful implementation its prolongation was considered by experts as inappropriate. The main reason was the presence of significant institutional barriers to the development of market mechanisms to encourage energy efficiency.
In 2006-2013 the major efforts to promote energy conservation and efficiency had moved into a sphere of responsibilities of the regional authorities. The new version of the Federal program “Energy saving and energy efficiency for the period up to 2020” (approved in April of 2013) did not change this situation. The basic approach to the implementation of EE policies in the program became the co-financing on a competitive basis of regional programs on energy conservation and efficiency.
3 The role of regional governments in realization of EE policy
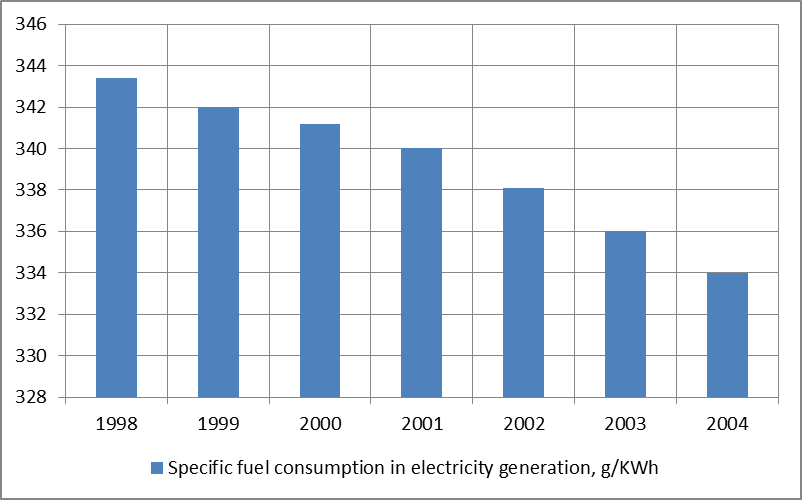
The shutdown of energy saving programs in 2006 has clearly shown that sectoral measures and, in particular, direct subsidies of projects in the fuel energy complex as a main energy consumer are no longer useful (Ratner 2014). The most important problems of this branch, including critical deprecation of main funds and inefficient use of fuel in electricity generation, have been solved (see Figure 1).
The primary idea of the newer and wider approach to developing EE policies has been dictated by the strong spatial heterogeneity of the Russian economic and energetic systems. These conditions have caused regional governments to be viewed as potential mediators between the federal government and individual companies and organizations that may evaluate the real social and economic conditions more adequately due to collecting, compiling, generalizing and distributing data necessary to form EE policies.
However, apart from the traditional argument of strong regional differentiation, the switch of focus for energy efficiency policies to the regional level can be further supported by a less popular, yet no less important argument: advantages of federalism for generating and diffusing managerial innovation. The positive influence of the federal government on the speed and quality of managerial decisions has been reasoned for in the works of Scruggs (2003), Levy (2007) and several other scientists, originally applied to ecological policies. That is explained by the fact that independence of regions in creating laws allows more space for experimentation and diffusion of best practices. The processes of diffusion for managerial innovations are stimulated by competition between regions for resources and induce learning effects. An empirical confirmation for these theories has been given very recently by (Schaffer, Bernauer 2014), who have managed to create econometric models for European statistics that confirm positive correlations between the federal structure of a state and the level of development of its ecology policy.
4 Regional programs on energy efficiency
First regional laws on energy efficiency were passed in 1996-1998 right after the first Federal Law of Russian Federation “On energy efficiency” No. 28-FZ. They did not provide any effective instruments to promote energy saving and did not set any specific goals. Some regions approved only limited number of legal acts, dealing with particular questions of energy efficiency such as street-lighting (Novgorodsky Region), limited energy consumption in regional government organizations (Jewish Autonomous Region, Magadan Region, Tambov Region, etc.) or energy audit in public sector companies (Republic of Bashkortostan, Sverdlovsk Region, etc.). First regional programs on energy efficiency (1998-2003) were also very restricted in policy instruments and therefore not very effective.
Regional programs in 2004-2008 were more specific in the development of new methods of incitement and motivation and pointed to the elaboration of new market-based instruments as a prior goal. Analyzing regional legislative acts adopted in 1997-2008, the following most popular tools to stimulate energy conservation and efficiency can be found: (1) funding for installation of meters from the budgets of all levels; (2) funding for regional EE programs from regional budgets; (3) funding for energy audit of the regional budget; (4) the financing of information campaigns on EE from regional budgets; (5) funding for the training of specialists in the field of energy saving from regional budgets (see Figure 2).
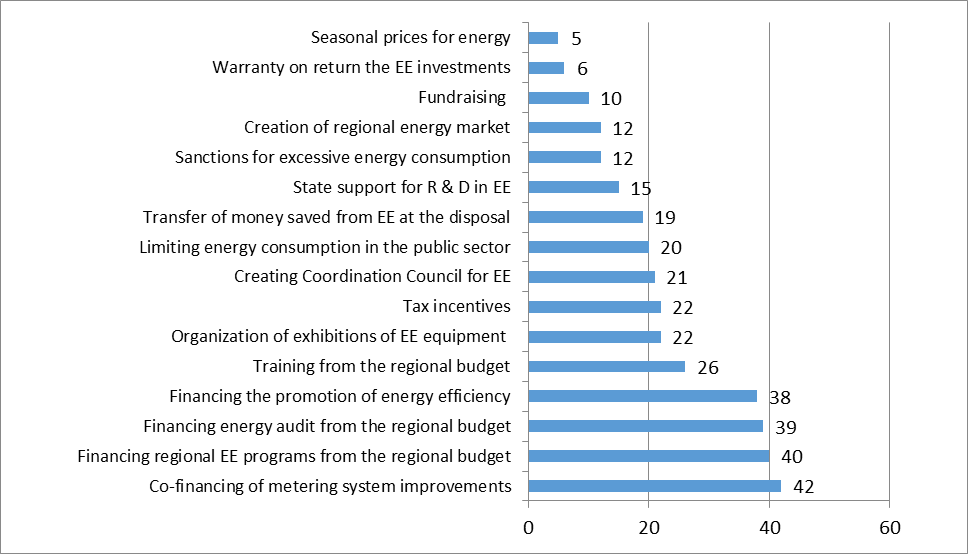
Using the classification proposed by Tanaka (2011), all the selected instruments of regional EE programs can be divided into three main groups: administrative, economic, and supportive. It is easy to notice that economic (co-financing, subsidies, tax incentives) and supportive (training, information) tools dominate among other instruments of regional programs. This is consistent with modern global trends of evolution of EE policies in industrialized countries.
In most regions, EE measures have brought about the expected effect (Ratner 2014). In addition, the implementation of regional EE programs generated a new tendency of smoothing existing extreme differences in energy intensity of the regions (see Table 1).
| Energy intensity of regional GDP,
| ||
| kg of fuel equivalent1/ 10 thousand rubles
| ||
| 2009 | 2010 | |
| Mean | 342.23 | 313.61 |
| Standard error | 18.53 | 16.91 |
| Median | 307.54 | 280.88 |
| Standard deviation | 165.76 | 151.21 |
| Sampling variance | 27475.74 | 22865.39 |
| Kurtosis | 3.37 | 3.34 |
| Asymmetry | 1.60 | 1.61 |
| Range | 905.68 | 852.90 |
| Minimum | 48.81 | 45.00 |
| Maximum | 954.49 | 897.90 |
| Valid Number of Observations | 80 | 80 |
| 1According to Russian statistics 1 kg of fuel equivalent equals 29.31 MJ | ||
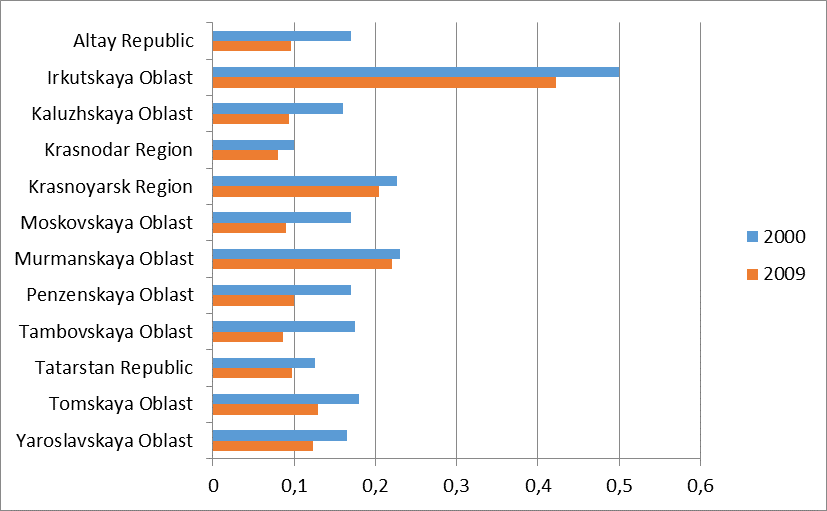
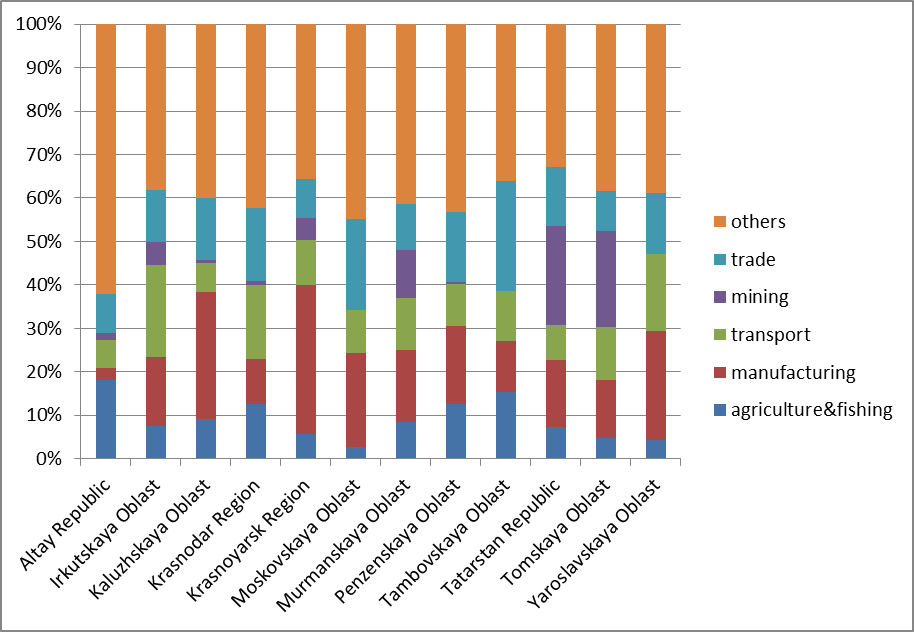
Investigation of regional statistics data does not help to mark the most important factors of energy intensity decline2 . Thus, comparing the data, presented on Figures 3 and 4, one can see that the rate of energy intensity decline differs in the group of regions with similar climate conditions (Krasnoyarsk Region, Irkutskaya Oblast, Altay Republic and Tomskaya Oblast are all located in Siberia) as well as in the groups of regions with the same structure of economy (for example, Krasnoyarsk Region and Kaluzhskaya Oblast with leading manufacturing sector or Krasnodar Region, Penzenskaya and Tambovskaya Oblast’s with significant share of agriculture and transport in regional GDP).
(mill kWh/thous. rub) Source: Author own study
Source: Author own study
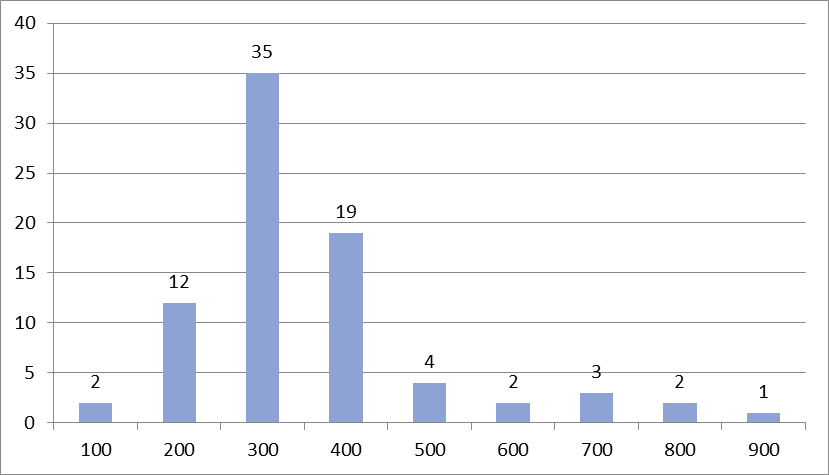
According to recent statistics, the energy intensity of the majority of Russian regions (67.5%) is in the range from 200 to 400 kg of fuel equivalent per 10 thousand RUB of gross regional product (GRP) (see Figure 5). Only two regions – Moscow City and Sakhalin region have energy intensity less than 100 kg of fuel equivalent per 10 thousand RUB. In twelve regions – the Republic of North Ossetia-Alania, Dagestan Republic, Sakha Republic, St. Petersburg City, Kaliningrad, Magadan, Tomsk, Kaluga, Khabarovsk, Kamchatka, Jewish Autonomous and Chukotka Autonomous regions – energy intensity is less than 200 kg f.eq./10 thousand RUB.
Thus, the group of least energy intensive regions (less than 300 kg of fuel equivalent per 10 thousand RUB) includes regions that vary considerably according to the sectoral structure of the economy, and on climatic conditions. For example, it includes such oil and gas regions as the Republic of Sakha (Yakutia) and Sakhalin Oblast, as well as industrialized Kaluga region and two capitals – Moscow and St. Petersburg. This group consists of both southern republics, such as Dagestan and North Ossetia-Alania and northern regions, such as Magadan, Kamchatka and Chukotka.
At the same time, 12 Russian regions – Vladimir, Tula, Irkutsk, Orenburg, Kemerovo, Chelyabinsk, Lipetsk and Vologda regions, the Republics of Chechnya, Karachay-Cherkessk, Buryatia and Khakassia – have GRP energy intensity from 400 to almost 900 kg f.eq./10 th.RUB (see Figure 6).

As in the previous case, the group includes regions with different sectoral structure of the economy (for example, agricultural Chechen Republic and the heavily industrialized Lipetsk region) and regions that belong to completely different climatic zones (e.g., southern Karachai-Cherkessk Republic and the northern Republic of Khakassia).
To evaluate the impact of the branch structure of regional economy on its energy consumption, a series of single-factor ANOVA tests have been performed. The statistical data on the volume of shipped goods of own production, works and services carried out in-house by economic activity (in actual prices, mln. rub.) from the digest “Regions of Russia. Socio-economic indicators – 2010” was used. According to (Ministry of Energy, 2009), industrial consumption is a dominant in the structure of energy consumption in the Russian economy. 43% of consumption is spent on mining and manufacturing, and if the needs of power plants themselves are included, this accounts for over 50%. The ANOVA analysis, therefore, has been used to evaluate the effect of “volume of regional production by mining”, “volume of regional production by manufacturing” and “volume of production and distribution of electricity, gas and water in region” on the GRP energy intensity.
In the first case, regions have been divided into four groups, depending on the amount of mining production in 2009. The most productive regions (100,000 million rubles and above) were the Republic of Sakha, Republic of Komi, Republic of Tatarstan, Arkhangelskaya, Orenburgskaya, Kemerovskaya, Sakhalinskaya and Tyumenskaya oblasts, as well as the Moscow city, which was excluded due to statistical peculiarities. The resulting indicator taken was the energy intensity of the GRP in 2009.
| Independent variable | Number of | F-calculated | F-critical | p-level |
| groups | ||||
| Volume of regional production | 4 | 0.673 | 2.726 | 0.571 |
| by mining in 2009 | ||||
| Volume of regional production | 4 | 1.623 | 2.725 | 0.190 |
| by manufacturing in 2009 | ||||
| Volume of production and | 4 | 1.020 | 2.726 | 0.388 |
| distribution of electricity, gas | ||||
| and water in region in 2009 | ||||
As can be seen from data provided in Table 2, the p-level of the F-test is significantly larger than the required value of 0.05, therefore, the factor of regional division into groups on mining activity has no significant effect on the energy intensity of the GRP.
In the second case, we checked the impact of manufacturing volumes on the energy intensity of the GRP. The regions were similarly divided into four groups by production volume: insignificant (below 20,000 million rubles), low (20,000-100,000 million), middle (100,000-500,000 million), and high (over 500,000 million). The high-volume group for this economic activity includes the republic of Tatarstan, Chelyabinsk, Nizhegorodskiy, Sverdlovsk, Tyumen regions, and the cities of Saint Petersburg and Moscow.
The ANOVA results show that the F-statistics (1.623) does not exceed the critical value of 2.725 on the required significance level (p = 0.05). The null hypothesis on the lack of impact from manufacturing volumes on the energy intensity of the GRP is therefore accepted.
The research of impact of the production volumes for the economic activity “production and distribution of electricity, gas and water” on the energy intensity of the GRP was performed in a third ANOVA-test. Regions were also split into groups of four, with insignificant (below 10,000 million rubles), low (10,000-20,000 million), middle (20,000-50,000 million) and high (above 50,000 million) volumes of production. The high production volume group for this indicator includes the republics of Tatarstan and Bashkortostan, Novosibirsk, Rostov, Orenburg, Chelyabinsk, Irkutsk, Leningrad, Saratov, Nizhegorodskiy, Samara, Kemerovsk, Sverdlovsk, Tyumen Moscow, Krasnodar, Perm and Krasnoyarsk regions and the cities of Saint Petersburg and Moscow.
The evaluated F-statistics value equals 1.02, and the critical value on the required statistical significance level (0.05) is 2.726. Therefore, the null hypothesis on the absence of impact from the economical activity of production and distribution of electricity, gas and water on the energy intensity of regional economy is accepted.
The latter results appear questionable and seem to contradict common sense in that the structure of the economy normally defines its energy intensity. However, they can be explained as follows: 1) the GRP energy intensity indicator, which is measured in a unit of standard fuel per unit of production, includes not only the energy consumption of the main production processes (which are typically electrified), but also the supporting ones (logistics, infrastructure support, etc.); and 2) the mean statistical indicators for regions and regional groups present only an overall outlook on the issue, “blurring” the specifics of production processes and accounting for factors that are not included in direct statistical measurements, such as the level of technology, quality of management and infrastructure, staff experience, etc.
A more detailed comparative analysis of the GRP energy intensity for regions with a high share of metallurgic production (which is assumed the most energy intensive) in the volume of shipped production in the economic activity of manufacturing is presented in Table 3.
| Regions | GRP energy | The level of the | Share of |
| intensity | volume of | metallurgic | |
| production by | production, % | ||
| economic activity | |||
| “Manufacturing” | |||
| Lipetsk Region | 866.92 | Middle | 65.6 |
| Volgograd Region | 954.49 | Middle | 65.8 |
| Krasnoyarsk region | 367.39 | Middle | 66.1 |
| Murmansk region | 353.56 | Low | 66.9 |
| Republic of Khakassiya | 859.38 | Low | 72.2 |
It is apparent that the GRP energy intensity is significantly different for the regions of Lipetsk, Volgograd and Krasnoyarsk, which are part of the same region group with a medium production volume in manufacturing and an insignificant difference in metallurgy in the structure of the shipped goods volume. A similar observation can be made comparing the energy intensity of the Murmansk region and the Republic of Khakassiya, which belong to the same region group with a low manufacturing volume and insignificant differences in metallurgy in the structure of the shipped goods volume.
Either way, these results indicate that the energy intensity of a regional economy depends not only on its structure, but also on other factors, which are not paid enough attention in the Russian literature.
5 Barriers to energy-efficiency
In the framework of the energy efficiency gap methodology, factors that possibly affect the energy intensity of the Russian regional economies include cost barriers and non-financial barriers. Let us review this question with greater scrutiny.
Given the fact that the tariffs for electricity and heat in the regions differ significantly, one possible explanation for these differences may be the presence of so-called “market barriers”, which can be divided into three main groups determined by instances (IPCC 2001, IEA 2007):
- 1.
- when energy prices are not an important factor in economic development;
- 2.
- when energy prices are low relative to other goods and services;
- 3.
- when the situation in capital markets impedes investment in energy-efficient technologies.
The existence of two first groups of market barriers can be considered as legitimate explanation if the regions with higher energy prices are less energy intensive. In case of high energy prices, a lot of EE-measures and technologies can become cost-effective and, therefore, more wide-spread causing regional economy to be less energy intensive. Such a pattern is actually observed in practice: our calculations carried out according to the statistic data3 showed that the average electricity flat-rate tariff for the least energy-intensive regions is substantially higher than the average tariff in the group of the most energy-intensive regions. This result is also proved with a single factor ANOVA test for all groups of regions (least, average and most energy intensive) on the p-level 0.001 (see Table 4).
| The level of energy | Number of regions | Average | Variance | F-statistics |
| intensity (EE) | (p-value) | |||
| Minimal EE | 14 | 3.347 | 1.488 | 7.691 |
| Maximal EE | 11 | 2.272 | 0.608 | (0.001) |
| Average EE | 49 | 2.596 | 0.278 | |
However, a strong variation in the tariffs in the group of regions with the least energy-intensive economies raises a question: can we consider market barriers (at least the first two of their group) an exhaustive explanation for the phenomenon that we study? The theory of energy efficiency gap clearly tells us that there are many economic, organizational, and behavioral obstacles that can stop cost-effective measures and technologies from wide practical implementation.
The most important non-market barriers to energy-efficiency in this time period have been illustrated and examined in multiple academic articles (Martinot 1998, Korppoo 2005, World Bank Group 2008, Ratner 2014). They highlight the lack of individuals motivated by environmental values; lack of expertise and competences to identify the inefficiencies; incomplete markets for energy efficiency; perception of being already efficient; and the lack of information about energy efficiency and renewable energy costs, benefits, geographic resources and opportunities. All these obstacles can be treated as institutional and behavioral barriers (Golove, Eto 1996, Sorrell et al. 2000, Vine et al. 2003). The manifestations of such barriers are difficult to measure, that’s why all of the above mentioned papers present the results of case studies or expert analysis and do not provide a quantitative information that helps to find a functional dependence of energy efficiency on institutional and behavioral factors.
Therefore, despite the popularity of the concept of extended energy efficiency gap proposed in Western literature as an explanation of many phenomena (including differences in energy intensity of production), we suggest that the main explanation for extremely high variances in the energy intensity of the Russian regions is the hypothesized difference in development of regional innovation systems.
It is known from the theory of innovation that external shocks (such as the rise in energy prices) initiate different responses in energy efficiency in the countries with advanced national innovation system (NIS) and in countries with underdeveloped NIS (Cheon, Johannes 2012, Popp 2002). The reaction of the countries that have developed NIS and a strong technological base is usually the growth of innovative activity in the field of energy efficiency and renewable energy, resulting in an increase in the number of patents in relevant areas of science and technology. The reaction of countries with underdeveloped NIS is to increase public funding for research and development in respective fields of knowledge, but the focus is on the development of already known technology in the country (Bergek et al. 2008, Jacobsson, Bergek 2004, Lipp 2007). For example, if a country owns a nuclear power technology, but does not develop the technologies of solar or wind energy, the funding most likely will be spent on research and development in the field of nuclear energy at the expense of all other areas (Unruh 2000, Newell 2010). This hypothesis has not been studied in either Russian or international literature on the regional level so far.
In the next section, we investigate the correctness of these theoretical and empirical findings for the level of regional innovation systems (RIS).
6 The reaction of regional innovation systems to elimination of market barriers to energy efficiency
The term “regional innovation system” (RIS) henceforth refers to the meso-level of the national innovation system (NIS): a combination of regional state, private, and social organizations and mechanisms of their interaction, in the framework of which activity on creating and sharing new knowledge and technology takes place (Golitchenko 2006).
The hypothesis of our study is that regions with more developed regional innovation systems are capable of responding to external shocks associated with a sharp increase in electricity tariffs by the introduction of various EE-innovations that eventually affect the energy intensity of the GRP.
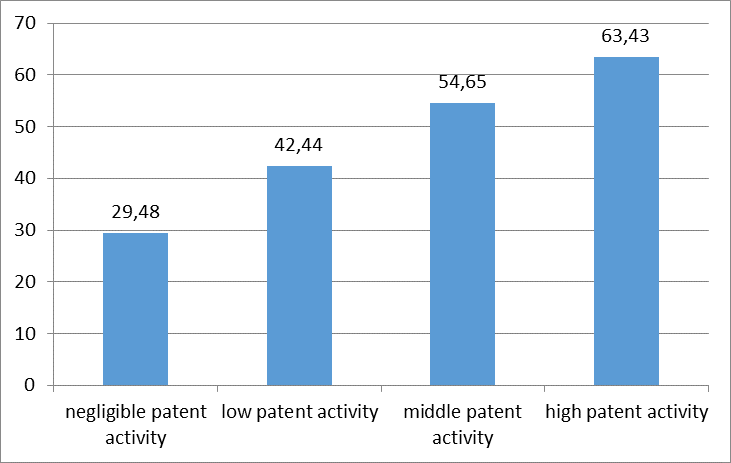
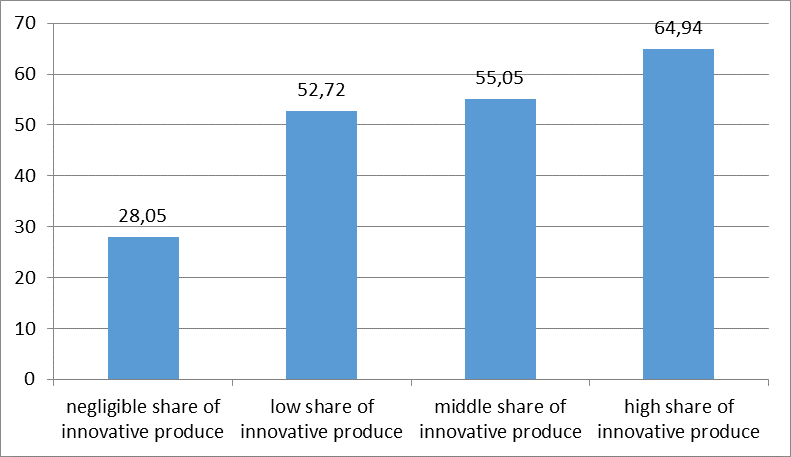
Following the traditional approach (Golitchenko 2006), we use the indicators of the RIS development level that reflect the state of the entrepreneurial environment and knowledge generation environment and mechanisms of knowledge transfer. Considering the specifics of the research task and limited abilities of the Russian regional statistics, the set of indicators of RIS development is decreased to four primary ones: the share of innovative production in overall shipped goods, performed works and services (susceptibility of the entrepreneurial environment to innovations); the volume of domestic spending on research and development financing; the number of issued patents (effectiveness of R&D); and the number of developed leading production technologies (conformity of R&D to the needs of technological development, as an indirect indicator of the knowledge transfer mechanism efficiency).
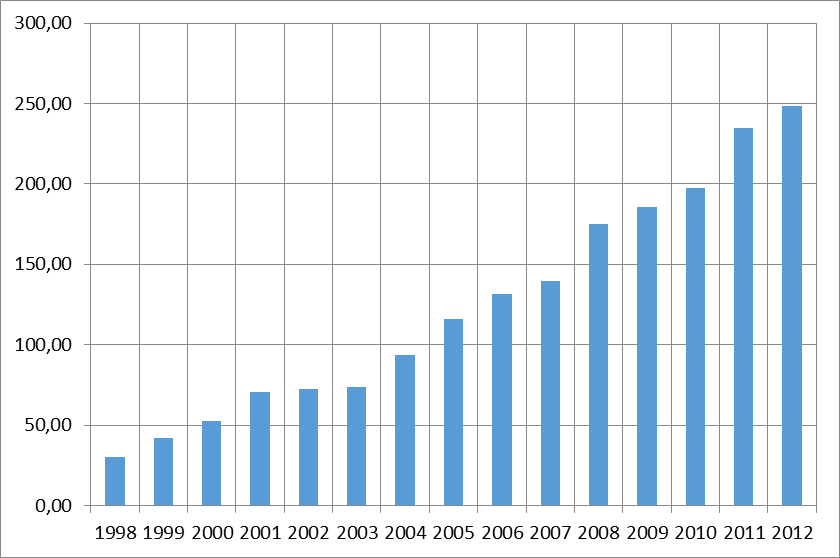
The increase of domestic electricity tariffs of 2007-2008 and 2010-2011, which are directly connected to the reforms of the electricity sector aimed at the liberalization of the electricity market may be viewed as an external shock to the economy of Russian regions (Ratner, Iosifov 2013). With the stable significant price variation between the different regions, the average flat–rate tariff for electricity in Russia has increased by 25% over one year (see Figure 7).
It is important to note that official statistics contain little information on what share of R&D performed by organizations is meant to increase energy efficiency. Only since 2010, the statistical digest “Regions of Russia. Socio-economic indicators” contains data on share of organizations (out of all companies that have undergone research in the region) that perform ecologic innovations. This is defined as “improvements realized as part of technology, marketing or organizational innovation for the purpose of increasing ecological safety of the production process and use of the innovative product”. Innovations meant to decrease energy consumption for producing a unit of goods or services are considered a subtype of ecologic innovations.
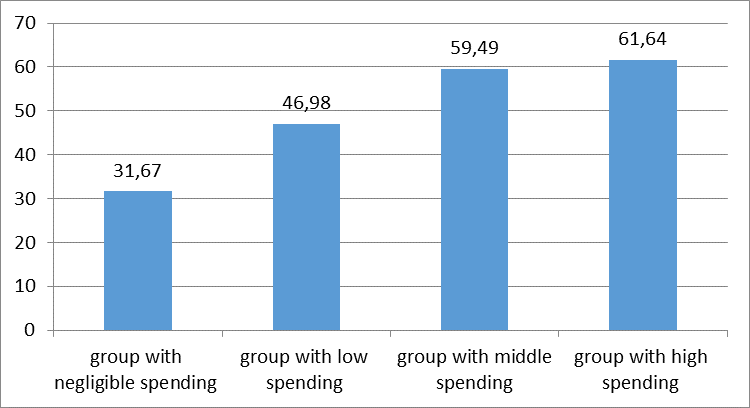
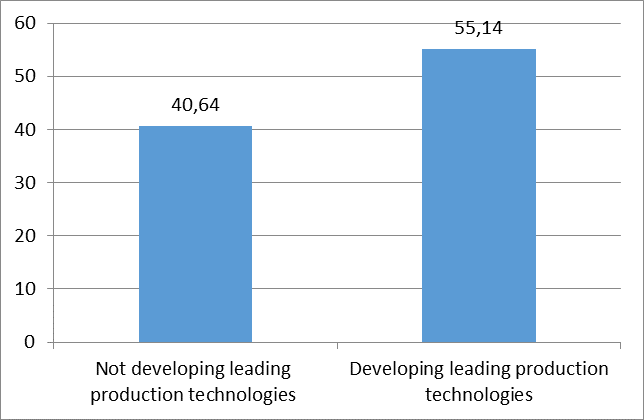
The share of companies working on EE-innovations for the year of 2010 (the earliest regional statistical data available) was used as the dependent variable in ANOVA analysis, the purpose of which was to find out whether the level of development of the regional innovation system affects the intensity of the innovative process in increasing energy efficiency. The results of ANOVA are presented in Table 5, the average values of dependent variable are presented in Figures 8 to 11.
| Independent variable | Number of | F-calculated | F-critical | p-level |
| Independent variable | groups | |||
| Internal R&D spending | 4 | 5.329 | 2.725 | 0.002 |
| Amount of developed leading | 2 | 4.571 | 3.963 | 0.036 |
| production technologies | ||||
| Amount of patents issued | 4 | 4.530 | 2.725 | 0.006 |
| Share of innovative produce in | 4 | 6.198 | 2.725 | 0.001 |
| overall volume of goods, | ||||
| products and services | ||||
The regions were divided into groups depending on the value of the independent factor, such that considerable differences in indicator values are accounted for and the amount of regions in each group is approximately equal to that in others. Frequency tables were built for each indicator beforehand.
It is apparent that not all indicators of RIS development affect the intensity of the innovative process in increasing energy efficiency, which is measured as the share of companies working on innovations to reduce energy consumption per unit of produce.
Let us review the question of how the intensity of the innovative process in energy efficiency improvement (measured as the share of organizations that perform innovations for reducing energy consumption per unit of produce) affects the energy intensity of the GRP. Using data on share of companies that perform energy efficiency innovations in 2010 (statistical digest “Regions of Russia. Socio-economic indicators – 2011”) and calculating the rate of decrease for GRP energy intensity based on data of years 2010-2011 (statistical digest “Russian industry – 2014”), we have built a model of linear regression that fits for all regions and shows the dependence of decreasing rate of GRP energy intensity on the share of organizations that perform energy efficiency innovations (see Table 6).
| Regression coefficient a | 0.224 |
| Standard error of regression coefficient | 0.031 |
| t-statistics of regression coefficient | 7.291 |
| p-level of t-statistics | 0.001 |
| F-statistics | 53.16 |
| p-level of F-statistics | 0.002 |
| Degrees of Freedom | 79 |
| Determination R2 | 0.402 |
| Correlation | 0.634 |
7 Conclusions
The following hypotheses were confirmed by this research:
- 1.
- The slow rate of decreasing energy intensity of the economy in Russia during the period of realizing state policies in energy saving and increasing energy efficiency (1998-current time) is not a result of inadequate choices or bad knowledge of tools for realizing this policy. The evolution of goals, problems, and tools of realizing current Russian energy efficiency policy follows the worldwide trends quite well. The findings have important practical implications for the future process of EE-policy elaboration and implementation. According to our results, in the case of a lack of effectiveness of regional EE- programs, the experimentation with new management tools is not necessary and helpful. The specific kinds of managerial tools are unimportant as long as they meet the current practice, but continuity and duration of their use is. Regions in which the implementation of EE-programs has not brought tangible results so far, need government support for the development of regional innovation systems. Regions which have reached some success in reducing the energy intensity of GRP are able to respond adequately to reduction of market barriers for energy efficiency and do not need government subsidies to regional EE- programs anymore;
- 2.
- As in many other technologically developed countries, there are certain barriers to increasing energy efficiency in Russia, including market and institutional barriers;
- 3.
- Extreme differences in energy intensity of regions of Russia are explained not only by structural, natural, and climatic peculiarities, but also by the level of development of regional innovation systems. Regions with better-developed innovative systems can react faster and more intensely to removal of market barriers for energy efficiency by decreasing the energy intensity of gross regional product (GRP).
These results have an important meaning for further formation and realization of state policies on energy efficiency. They show that in case of insufficient efficiency of regional EE-programs, experimenting with new management tools is unnecessary and unfounded. The management tools are less important than the consistency and length of their use, as long as the tools conform to the modern practice.
Regions, in which realizing EE-programs has not borne any notable fruit yet, require state support for developing regional innovative systems. These supportive measures do not necessarily need to be of economical character. Regions that have been, on a certain level, successful in decreasing GRP energy intensity, are capable of adequately reacting to removal of market barriers for energy efficiency, and no longer require state subsidies for regional energy efficiency and energy saving programs.
References
Almeida E (1998) Energy efficiency and the limits of market forces: the example of the electric motor market in France. Energy Policy 8: 643–653
Ayres R (1969) Technological forecasting and long-range planning. McGraw-Hill, New York
Backlund S, Thollander P, Palm J, Ottosson M (2012) Extended energy efficiency gap. Energy Policy 51: 392–396. CrossRef.
Bashmakov I, Myshak A (2014) Russian energy efficiency accounting system. Energy Efficiency 7: 743–759. CrossRef.
Bergek A, Jacobsson S, Sandén BA (2008) ‘Legitimation’ and ‘development of positive externalities’: two key processes in the formation phase of technological innovation systems. Technology Analysis and Strategic Management 20: 575–592. CrossRef.
Brown M (2001) Market failures and barriers as a basis for clean energy policies. Energy Policy 29: 1197–1207. CrossRef.
Busch P, Jörgens H (2012) Europeanization through diffusion? Renewable, energy and policies and alternative sources for European convergence. In: Morata F, Sandoval IS (eds), European Energy Policy: An Environmental Approach. Edward Elgar Publishing, Cheltenham, 66–84. CrossRef.
Cheon A, Johannes U (2012) Oil prices and energy technology innovation: An empirical analysis. Global Environmental Change 22: 407–417. CrossRef.
Eyre N (1997) Barriers to energy efficiency: more than just market failure. Energy and Environment 8: 25–43
Fromme JW (1996) Energy conservation in the Russian manufacturing industry: potentials and obstacles. Energy Policy 24: 245–252. CrossRef.
Golitchenko OG (2006) National innovation system of Russia: current status and ways of development. Naukas, Moscow. (in Russian)
Golove W, Eto J (1996) Market barriers to energy efficiency: a critical reappraisail of the rationale for public policies to promote energy efficiency. Berkeley: Energy & environment division, Lawrence Berkeley National Laboratory. CrossRef.
Holzinger K, Knill C, Sommerer T (2008) Environmental policy convergence: The impact of international harmonization, transnational communication, and regulatory competition. International Organization 62: 553–587. CrossRef.
IEA – International Energy Agency (2002) Russia energy survey. Paris: IEA
IEA – International Energy Agency (2006) Russian electricity reform. Paris: IEA
IEA – International Energy Agency (2007) Mind the gap – quantifying principal-agent problems in energy efficiency. Paris: IEA
IPCC – Intergovernmental panel for Climate Change (2001) Barriers, opportunities, and market potential of technologies and practices. In: IPCC (ed), Climate Change 2001: Mitigation. Intergovernmental panel for Climate Change, Cambridge, UK, 345–398
Jacobsson S, Bergek A (2004) Transforming the energy sector: the evolution of technological systems in renewable energy technology. Industrial and Corporate Change 13: 815–849. CrossRef.
Jaffe A, Stavins R (1994) The energy-efficiency gap: what does it mean? Energy Policy 22: 804–810. CrossRef.
Korppoo A (2005) Russian energy efficiency projects: lessons learnt from activities implemented jointly pilot phase. Energy Policy 33: 113–126. CrossRef.
Levy J (2007) Federalism, liberalism and the separation of loyalties. American Political Science Review 101: 459–477
Lipp J (2007) Lessons for effective renewable electricity policy from Denmark, Germany and the United Kingdom. Energy Policy 35: 5481–5495. CrossRef.
Martinot E (1998) Energy effciency and renewable energy. Energy Policy 26: 905–915. CrossRef.
Newell R (2010) The role of markets and policies in delivering innovation for climate change mitigation. Oxford Review of Economic Policy 26: 253–269. CrossRef.
Parry I, Evans D, Oates W (2014) Are energy efficiency standards justified? Journal of Environmental Economics and Management 67: 104–125. CrossRef.
Popp D (2002) Induced innovation and energy prices. American Economic Review 92: 160–180. CrossRef.
Ratner S (2014) The evolution of Russian macro-level management – the case of energy efficiency policy. International Journal of Contemporary Management 13: 51–71
Ratner S, Iosifov V (2013) Financial barriers for renewable energy technologies in Russia. Economical Analysis: the Theory and Practice 40: 25–33. (in Russian)
Ratner S, Iosifova L (2014) Informational barriers as a factor of new technologies diffusion slowdown. Economical Analysis: the Theory and Practice 16: 14–28. (in Russian)
Sandén BA, Azar C (2005) Near-term technology policies for long-term climate targets: economy wide versus technology specific approaches. Energy Policy 33: 1557–1576. CrossRef.
Schaffer LM, Bernauer T (2014) Explaining government choices for promoting renewable energy. Energy Policy 68: 15–27. CrossRef.
Scruggs L (2003) Sustaining Abundance: Environmental Performance in Industrial Democracies. Cambridge University Press, Cambridge
Sorrell S (2009) Jevons’ paradox revisited: The evidence for backfire from improved energy efficiency. Energy Policy 37: 1456–1469. CrossRef.
Sorrell S, Schleich J, Scott S, O’Malley E, Trace F, Boede U, Ostertag K, Radgen P (2000) Reducing barriers to energy efficiency in public and private organizations. Brighton: Energy research centre – science and technology policy research (SPRU), University of Sussex
Tanaka K (2011) Review of policies and measures for energy efficiency in industry sector. Energy Policy 39: 6532–6550. CrossRef.
Unruh GC (2000) Understanding carbon lock-in. Energy Policy 28: 817–830. CrossRef.
Vine E, Harmin J, Eyre N, Crosley D, Maloney M, Watt G (2003) Public policy analysis of energy efficiency and load management in changing electricity businesses. Energy Policy 31: 405–430. CrossRef.
Volkova ED, Zakharov AA, Podkoval’nikov SV, Savel’ev VA, Semenov KA, Chudinova LY (2012) System and management problems of the electric power industry’s development in Russia. Studies on Russian Economic Development 23: 363–370. CrossRef.
World Bank Group (2008) Energy Efficiency in Russia: Untapped Reserves. IFC-World Bank, Washington D.C.
Zhang YJ (2011) Interpreting the dynamic nexus between energy consumption and economic growth: Empirical evidence from Russia. Energy Policy 39: 2265–2272. CrossRef.