 Volume
4, Number 1, 2017, 129–146 journal homepage:
region.ersa.org
Volume
4, Number 1, 2017, 129–146 journal homepage:
region.ersa.orgDOI: 10.18335/region.v4i1.146
Regional Public Stock Reductions in Spain: Estimations from a Multiregional Spatial Vector Autorregressive Model
1 University of Extremadura, Badajoz, Spain (email: mmarquez@unex.es)2 University of Extremadura, Badajoz, Spain (email: ramajo@unex.es)
3 University of Illinois Urbana-Champaign, Urbana-Champaign, IL, USA (email: hewings@illinois.edu) Received: 21 July 2016/Accepted: 12 May 2017
Abstract. The estimation of the impact of public investment on regional economic growth requires consideration of the spatio-temporal dynamics among the state variables of each region. According to recent data, public investment in Spain has fallen in recent years, and in some regions the reduction has been so severe that public investment has not been able to replenish depreciated capital. Recent austerity policies in Spain that feature temporary decreases in the accumulation of regional public capital should thus be evaluated in terms of their impact on the economy as a whole and on specific regions together with the spillover effects from one region to the rest of the regional system. This paper uses a multiregional integrated specification to model interdependencies across regions; our results indicate that while global decreases in public investment have a homogeneously negative effect on the output of all Spanish regions, these regions portray heterogeneous responses from localized public capital stock reductions over the simulation period considered.
Key words: Regional investment; Public capital stock; Spillovers; Multiregional; Spatial econometrics; Vector autoregressions; Spain
1 Introduction
The international financial and economic crisis has had a major impact on European national budgets with European governments now increasingly trying to rebalance budgets, in most cases, by considering substantial expenditure cuts to eliminate budget deficits. The regional impacts of these budget adjustments are unlikely to be spatially blind generating the possibility that they will exacerbate existing disparities in welfare. The impact of austerity measures on public capital stock needs to be evaluated carefully; restrictive fiscal measures will require the consideration of new strategies on the one hand, and on the other hand, the impacts that spending reductions will have on policies to stimulate economic growth. National governments need to consider how best to rationalize public investment, and new tools are necessary to guide and prioritize these investments. Most analysts agree that unless policies are refocused to take up the new challenges, GDP could potentially fall across many European countries. At the regional level, in the face of declining resources, nations will be forced to prioritize how and where they invest public funds across regional areas. In this context, it is necessary to develop and implement quantitative approaches to guide infrastructure development and this paper tries to make a contribution to the provision of strategic information. For example, from a welfare perspective, across the board cuts (i.e. public expenditures are reduced by a similar percentage in all regions) may have a different total impact from reductions that are targeted to specific programs or in specific regions – even though the total volume of expenditure cuts might be the same in both cases. The complexities of the spatial allocation and the manner in which spatial spillover effects move across the region system require formal analysis of the kind proposed in this paper1 .
It is well known that the empirical analysis of the aggregate effects of regional public capital provision requires spillover effects to be considered (see, for example, Boarnet 1998, Moreno, López-Bazo 2007). These spillover effects could play a key role in regional economic performance, since they can be inferred as externalities that could lead to increasing returns to scale. Indeed, public capital accumulated in one region can create additional growth potentials in other regions. In this paper, growth spillovers are understood to characterize a situation in which some of the growth in a region may be traced to the public investment in neighboring regions. Following Capello (2009), the transmission channels of the influences from changes in the capital stock in a single regional economy to the growth of neighboring regional economies (and vice versa) will be via trade linkages and market relationships. Further, it is expected that trade linkages will transmit either positive or negative effects.
In the literature, one can appeal to input-output based analyses such as the hypothetical extraction method of Dietzenbacher et al. (1993). More complete evaluations could be accomplished with a multiregional computable general equilibrium model, adopting a similar strategy but with the added benefit of being able to trace some of the economy-wide impacts of fiscal re-allocations and differential tax rates (see McGregor, Swales 2003). A third alternative, adopted in this paper, is to use a multiregional integrated spatial vector autoregressive model (see Ramajo et al. 2017) to capture both the short-run and longer-run impacts of significant changes in fiscal policy. None of these approaches by themselves would encompass all of the necessary perspectives to address the problems at hand, but together they offer a rich source of information for policy analysts. The present paper promotes the third approach as a complement to the other two (rather than as a substitute) with a particular focus on the evaluation of austerity measures.
According to a recent research (Serrano Martínez et al. 2017), public investment in Spain has fallen almost 60% since 2009 and in some regions the reduction has been so severe that it has not been able to replenish depreciated capital. As such, it would be very interesting to simulate the effects of a reduction in the public stock of infrastructures. This paper specifies a ‘global’ approach to assess how output in every Spanish region is affected by a reduction in the public capital stock of another specific Spanish region. Specifically, a multiregional integrated spatial vector autoregressive (MultiREG-SpVAR) model is applied that allows the investigation of spatio-temporal interdependencies across regions2 . This model is used to assess the magnitude of both intra-regional (domestic) and inter-regional (spillover) effects of public infrastructure for the regions of Spain. Domestic effects are understood to be the effects derived from public capital installed in the region itself, while the spillover effects are those derived from public capital installed outside the region.
The rest of the paper is organized as follows. Section 2 briefly reviews some issues about both the domestic impact of public capital on regional economic growth and the spillovers effects of this type of capital, providing the intuition behind the empirical findings. Section 3 exposes the econometric background behind the MultiREG-SpVAR specification. Section 4 describes the Spanish regional system, and presents the database. The empirical application in Section 5 estimates the domestic and spillover effects of public capital in the Spanish regional system, and a discussion of the main implications of the empirical results are provided. Finally, Section 6 provides some summary remarks.
2 Theoretical background
The effect of public-sector capital on economic growth has been a recurring issue in economics. Initiated the seminal article by Ratner (1983) more than three decades ago, this literature was further stimulated by Aschauer (1989), who hypothesized and tested the role of public infrastructure investment on productivity and produced the result that it had a substantial impact. Nevertheless, the posterior evidence was not homogeneous. To name only a few works, Lynde, Richmond (1992) and Morrison, Schwartz (1996) argued that public capital investments fosters economic growth, while the empirical work by Tatom (1991) and Holtz-Eakin (1994) among others found that public capital formation is not a robust determinant of private output; other authors like Seitz (1993) and Devarajan et al. (1996) found negative effects of public capital on economic growth.
There is a substantial literature in regional economics on the impact of public expenditure on regional economic growth (see, among others, Munnell 1990, Garcia-Mila et al. 1996, Sturm et al. 1998, Destefanis, Sena 2005). More recently, there is an emerging consensus in the literature about the positive impacts of public infrastructure on per-capita income and productivity in the private sector (see, for example, Henderson, Kumbhakar 2006, Cohen, Morrison Paul 2007, Heintz 2010), although the effects are not as large as Aschauer (1989)Aschauer (1989) suggested.
The review of the extensive literature by Romp, De Haan (2007) highlights different approaches used to estimate the effects of public capital on regional economic growth3 : production functions, cost functions and VAR/VECM models. In a survey of the literature measuring the impact of public investment expenditure, De la Fuente (2010) focuses on studies estimating aggregate production functions or growth equations, concluding that the contribution of public infrastructure investment to productivity growth is significant. Within the cost function approach, the pioneering work of (Deno 1988) stimulated studies at the regional level (e.g. Seitz, Licht 1995, Morrison, Schwartz 1996); while the data requirements for this type of approach are greater than in the case of the production-function approach, the main advantage is that the cost-function approach is more flexible than the production-function approach.
Finally, among the main methods, the use of the VAR approach to test the significance of the dynamic effects of public capital on economic growth presents some advantages (Kamps 2005). Whereas other approaches assume a causal relationship running from the inputs to economic output, the VAR approach does not impose any causal links between the variables a priori4 . The VAR approach, although atheoretical in nature, allows for the existence of indirect links between the variables under investigation. In addition, it provides the opportunity to test the number of long-run (cointegrating) relationships. Moreover, if the number of long-run (cointegrating) relationships are tested and estimated consistently, the vector error correction (VEC) models would produce consistent estimates of the impulse response functions. With respect to the empirical literature where the VAR methodology has been used to simulate the effects of unexpected changes in the public capital on macroeconomic variables, it is possible to find different contributions at both country and regional levels. Recently, for example, Hunt (2012) worked with a set of OECD countries, Deliktas et al. (2009) analyzed seven regions of Turkey and Roca-Sagalés, Sala (2006) investigated the effects of public capital using the VAR approach for seventeen Spanish regions. Much of the previous empirical work appears to posit the existence of cross-sectional independence, which is unlikely to be the case.
Although the approach used in the present paper shares the same starting point with previous empirical work using the VAR approach, the present approach relates more closely in spirit to recent work in regional economic growth through its preoccupation with the problem of spatio-temporal dynamics (e.g. Márquez et al. 2010b). Clearly, the processes of regional economic growth intrinsically embrace space and time interactions. Even though the effects of public capital formation considering spatio-temporal interactions at the regional level have received increasing attention over recent years (for example, see Pereira, Roca-Sagalés 2003), past research on the impact of public capital on regional growth has mainly ignored two relevant challenges. First, it has not considered the estimation of the spillover effects of a reference region’s public capital on the economic growth of any other region of the country. Secondly, there has been no attempt to integrate, in some fashion, the state variables of each region with the state variables of the rest of the regions to provide a global perspective that allows for the investigation of interdependencies across regions. Consequently, the resulting parameter estimates and statistical inference of the empirical work produced to date could be open to criticism. Tackling these two problems simultaneously will allow the quantification of the contribution to overall regional economic growth of the provision of public capital in a determined region, making available an important tool to assist in formulating economic policies.
To deal with these open questions, the approach used in the present paper is the confluence of the recent empirical literature on the effects of public capital using VAR models (consistent with the argument that the analysis of these effects requires the consideration of dynamic feedbacks among the different variables) with the new developments in macroeconometric modeling following the Global VAR approach proposed by Pesaran et al. (2004) and Dees et al. (2007). The multiregional integrated approach (Ramajo et al. 2017) will contemplate both the spatial and temporal growth output effects derived from public infrastructure at the regional level.
At the aggregate level, it is not easy to disentangle the effects of public expenditure on regional growth; it is especially difficult to identify the channels through which they operate. The economics literature (see among others Gramlich 1994, Romp, De Haan 2007) highlights different channels through which public investments influence economic growth. The first channel makes reference to the direct increased flow of output due to the accumulation or the stock of public capital over time. Other channels are connected to the effects derived from the interactions between public and private capital; namely, the direct effects on productivity of private production inputs, the crowding-out effect on private spending through financial mechanisms, and the complementary effect from private investment. Following Baxter, King (1993), the aforementioned channels could generate both short-run and long-run effects. These traditional effects operate at the same time as other effects emphasized by Agénor, Moreno-Dodson (2006): indirect effects on the productivity of workers, effects related to adjustment costs in both private capital formation and its mobility, effects connected to the creation of production facilities that encourage economic activities, effects derived from enhancing the durability of private capital, and effects resulting from the positive outcomes on growth coming from improvements in health and education. Hence, there are a variety of ways in which public capital could affect economic growth.
It is important to highlight that the presence of strong spatio-temporal dynamic interaction effects can alter the standard predictions about the macroeconomic implications of regional public investment. The shifts in public capital could lead to potential multiplier effects that induce dynamic responses on regional growth. In turn, these dynamic responses within a single regional economy can influence the growth of neighboring regional economies (Cheshire, Carbonaro 1996). Although different works provide arguments that consider spatial spillovers from public infrastructures (Holtz-Eakin, Schwartz 1995, Álvarez et al. 2006, Yu et al. 2013)(see among others, Holtz-Eakin and Schwartz, 1995; Alvarez et al., 2006; Yu et al., 2013), regional trade linkages occupy a relevant place among the different transmission channels of the effects of regional public capital expenditure on the growth of the regions integrating the regional economic system (Capello 2009). Following the methodological approaches presented in Márquez et al. (2010a), a distinction can be made between growth spillovers sent from a region to its trade-related neighboring regions (push-out effects) and growth spillovers received for a region from its trade-related neighboring regions (push-in effects). From a theoretical perspective, push-in and push-out effects could exert positive or negative influences on the growth of regional economies (Young 1991, Chung, Hewings 2015). Nevertheless, and according to the recent literature (see Melitz, Ottaviano 2008), one could expect that regional growth spillovers transmitted through trade linkages would have a positive effect on the growth of other regional economies in the short run; but the impact in the long-run may be ambiguous. Effectively, these growth spillovers could stimulate regional growth through, among other ways, increases in productivity derived from competitive pressures from trade, from learning-through-trade, and from enhanced access (lower cost, more reliable service etc.) to inputs, outputs and intermediates. Alternatively, trade can displace regional production and regional factor productions, leading to a negative effect on growth. Taken all together, it is clear that the empirical outcomes derived from the effects of regional public capital on the growth of trade-related regional economies can be mixed. All of these growth spillovers must be addressed in advocating and developing an alternative to current approaches to measuring and understanding what are the regional effects of public investment.
3 The Multiregional Spatial Vector Autoregressive (MultiREG-SpVAR)
model5
To capture both the domestic and the spillover effects of public capital among the Spanish regions, a multiregional integrated spatial vector autoregressive model has been built following the Global VAR macroeconometric modeling approach proposed by Pesaran et al. (2004) and Dees et al. (2007).
In similar fashion to Global VAR models, our MultiREG-SpVAR specification provides a multi-location framework that allows the investigation of interdependencies across regions and is composed of individual models formulated by corresponding spatial VAR specifications (namely VAR models augmented by spatially-lagged variables) that are combined in a consistent manner. Each region is linked with the others in the regional system under study by including spatial lags in the econometric specification. In this way, all regions are potentially affected by developments in the other regions of the system. In this paper, the spatial lags have been constructed using spatial weights that are based on region-region trade flows as explained in Section 4.
Consider N regions, indexed by i = 1,2,…,N, then the Spatial VAR (SpVAR) model for each region i at time t (t = 1,2,…,T) is formulated as follows:

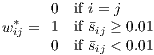
where xit is the vector of internal state variables, xit* is a vector of external spatially-lagged variables that summarizes the state of the economy in the other regions (their components, xg,it* = ∑ j=1Nwijxg,jt, are a weighted average of xg in all regions except the ith, since, by convention, xii = 0), t is a vector of deterministic time trends, Λjt (j = 0,1), Γji (j = 1,2,…,p) and Φji (j = 0,1,2,…,q) are matrices of coefficients to be estimated, and uit is a vector of disturbances assumed to be serially uncorrelated with a zero mean and a non-singular covariance matrix, Σii.
The first step in building the MultiREG-SpVAR model, each regional SpVAR model is estimated individually and then the individual models are stacked to yield a ‘global’ compact specification in terms of a vector containing all the endogenous variables of the regional system, xt = (x1t′,x2t′,…,xNt′)′:
 | (2) |
for appropriate matrices Ψj (j = 0,1) and Fk (k = 0,1,…,r), with r = max(pi,qi), where there are no restrictions on the covariance matrix Σe = Cov(et). This expression is the basis for the analysis of the dynamic properties of the multiregional mode.
Although the model allows consideration of the regional interdependencies and heterogeneity in the underlying dynamic process, analyzing within the regional system the response of every region to a temporary shock in a state variable of one specific region (for more details, see Ramajo et al. 2017), the model does not allow the quantification of the relevance of different channels for transmission of spillovers.
4 The Spanish regional system and the database
The database used consists of yearly time series over the period 1964-2003 for the Spanish Autonomous Communities6 . The analysis of this specific period is the interest of the paper. The paper explores the space-time dimensions of this evolutionary period, and the Multireg-SpVAR model is appropriate to accomplish this. The Autonomous Communities of Spain have achieved the status of self-governed territories, sharing governance with the Spanish central government within their respective territories. Given the transfer of important economic responsibilities from the central government to the regional executives, the NUTS2 level of disaggregation in Spain is the most interesting level from a political economy perspective. Currently, almost one third (about 31%) of the regional investments are carried out by the autonomous communities, almost a quarter (about 24%) by the central government, with local corporations and other public entities accounting for the remaining 45%. Thus, both central government and regional authorities are able to decide how public expenditures are allocated.
For each region, the macroeconomic variables that compose the vector xit are the following: gross value added, GVA, measured at basic prices in thousands of year 2000 constant euros; total employment (E), in thousands of employed persons; and private (KPR) and public (KPU) net capital stocks7 , in thousands of year 2000 constant euros. The regional series for GVA and E have been drawn from the BD.MORES database (Bustos et al. 2008) and the time series for KPR and KPU have been taken from the Fundación BBVA-Ivie database (Mas et al. 2009)8 . Some summary statistics of these variables for the seventeen Spanish regions are shown in Table 1 (for reasons of comparability, the figures in this table are percentage shares; however, all the calculations in the paper have been made with the original data in logarithmic terms).
| GVA | E | KPR | KPU | |
| AND | 13.8 | 15 | 13.6 | 14.9 |
| ARA | 3.1 | 3.2 | 3.5 | 4.4 |
| AST | 2.2 | 2.2 | 2.5 | 3.1 |
| BAL | 2.4 | 2.4 | 2.7 | 1.7 |
| CAN | 4.1 | 4.1 | 4.5 | 4.3 |
| CANT | 1.3 | 1.3 | 1.3 | 1.5 |
| CAT | 18.8 | 17.8 | 18.4 | 14 |
| CLM | 3.4 | 4 | 3.8 | 4.9 |
| CYL | 5.5 | 5.7 | 6.2 | 8.1 |
| EXT | 1.7 | 2 | 2 | 2.5 |
| GAL | 5.1 | 5.7 | 5.2 | 6.4 |
| MAD | 17.7 | 15.8 | 15.6 | 13.7 |
| MUR | 2.5 | 2.8 | 2.3 | 2.3 |
| NAV | 1.7 | 1.7 | 1.8 | 1.9 |
| PV | 6.2 | 5.5 | 6.4 | 6 |
| RIO | 0.8 | 0.8 | 0.8 | 0.9 |
| VAL | 9.7 | 10.3 | 9.4 | 9.3 |
| SPAIN | 100 | 100 | 100 | 100 |
Regional Abbreviations: Andalusia (AND), Aragón (ARA), Asturias (AST), Balearic Islands (BAL), Canary Islands (CAN), Cantabria (CANT), Catalonia (CAT), Castile-La Mancha (CLM), Castile and León (CYL), Extremadura (EXT), Galicia (GAL), Madrid (MAD), Murcia (MUR), Navarre (NAV), Basque Country (PV), La Rioja (RIO) and the Valencian Community (VAL).
With respect to the vector of non-domestic variables xit*, in our application, these have been built using trade-based weights wij in order to capture the economic interaction of region j with the ith region’s economy and not only the geographic interaction. These weights were computed using data on interregional trade in Spain drawn from the C-Intereg database (Llano et al. 2008, 2010). Initially, mean trade shares (ij) were computed as the proportion of region j in the total trade (exports plus imports) of region i over the period 2004-2007 (measured in millions of euros)9 . Thereafter, a binary trade-based spatial weight matrix was built defining non-normalized weights as and finally a row-standardized weights matrix was defined as
 | (3) |
and finally a w row-standardized weights matrix was defined as wij = wij*∕∑ jwij*.
Thus, only trade-neighbors of region i those regions j that have a mean trade share above 10% of the total trade were used. This criterion is based on the idea that only ‘relevant trader regions’ have non-negligible spatio-temporal effects on their neighbors; the remaining regions were assumed to be less important and thus have negligible individual impacts. The 10% critical cut-off point yields a set of 3 to 5 (not necessarily contiguous) neighbors. To check the robustness of our results, two other values (5% and 15%) were adopted, and the results were qualitatively similar to those presented in this paper, and thus were omitted for the sake of brevity.
5 Empirical application: effects of public capital in the Spanish regional system
The issue of the effects of public capital formation on economic development is currently at the center of the policy debate in many European countries. The policies available to states are limited because, given existing resources, it is not possible to maintain the current levels of public investment. Due to economic and budget pressures, nations have to prioritize where and how they allocate public expenditure.
This section focuses on the estimation of both domestic and spillover effects of public capital innovations on regional outputs in Spain. The effects derived from a hypothetical reduction of public capital in the Spanish regional system are identified in order to determine the key regions that generate, sustain and improve the productive capacity of the regional economic system. The detection of these ‘key regions’ would contribute to enhancing the set of strategic information necessary to ensure the most efficient allocation of regional public investment in the context of economically interrelated regions and in prioritizing the provision of public resources.
Next, the estimation results of the MultiREG-SpVAR for the Spanish regional system are presented. Due to the very large number of regressions, as well as preliminary or intermediate results involved in the estimation, only the main estimation and specification test results are presented (see Ramajo et al., 2015, for details). In summary, given that all the conditions for the Global VAR approach are accomplished, the estimation of the MultiREG-SpVAR is justified, and the dynamic properties of the model can be investigated10 .
Thus, the purpose is to simulate the response of the system to either a unitary (one standard error) shock in one internal variable in one specific region, or a unitary global shock (a GVA-weighted average of variable/regional specific unit shocks across all the regions in the system) in the whole regional system. Given the existence of trade links between regions that are incorporated in the model, other regions in the system will be (more or less) affected from the disturbance, providing relevant information about the degree of interregional spillovers in the Spanish regional system.
In this application, both the domestic and spillover effects of one-time innovations in the public capital installed in one region are estimated, as are the effects of a global shock to public capital in the country on the output growth of the regions of Spain. Given the actual economic situation of the Spanish economy, characterized by a sizeable reduction in the government’s current and infrastructure expenditure, negative shocks to public capital are simulated as either area-wide or individual shocks scenarios: a) a negative global shock to total public capital in Spain; and b) a negative unit shock to public capital in each region.
Tables 2 and 3 show detailed estimated effects in the first and the fifth years. In these tables, the last row shows the effects of a global shock, not originating in a particular region but common to the Spanish economy as a whole (it is defined as a GVA-weighted average of shocks to the public capital in all 17 regions in Spain); the remaining rows display the region-specific shocks, where the shaded cells document the own-response of output to a domestic public capital shock, and the non-shaded elements record the spillover effects in the different regions of Spain. As can be seen in Tables 2 and 3, the responses of output to a negative unit shock in public capital have more heterogeneous responses (positive and negative effects) initially than after five years (where negative responses clearly prevail).
Starting from the first shock scenario (a negative global shock to total public capital in Spain), the effects on output of a common global negative shock to the public capital in the Spanish economy as a whole are contained in the last row of Tables 2 and 3. It should be noted that the term global is used in a way that departs from the empirical definition applied in other empirical research. In this paper, the term global shock makes reference to an overall shock for the Spanish regional system, including all of the dynamic feedbacks among the trade-related regions.
While a common global negative shock to the Spanish economy as a whole has initially mixed effects on the regions (positive and negative, see Table 2), after 5 years the shock has similar (negative) impacts (see Table 3). The strongest negative effect from this initial (negative) global shock can be found in Castile La Mancha (-2.49%), closely followed by the Basque Country (-2.37%). The weakest negative effects are found in La Rioja (-0.64%), Extremadura (-0.65%) and Cantabria (-0.93%).
| Shock in: | AND | ARA | AST | BAL | CAN | CANT | CAT | CLM | CYL | EXT | GAL | MAD | MUR | NAV | PV | RIO | VAL |
| AND | -0.21 | -0.05 | -0.04 | -0.21 | 0.31 | 0.06 | -0.1 | 0 | -0.09 | 0.15 | 0.15 | 0.07 | -0.06 | 0.05 | -0.05 | 0.04 | 0.06 |
| ARA | -0.01 | 0.07 | -0.15 | 0.05 | 0.62 | 0.09 | 0.05 | -0.01 | 0.04 | 0.27 | 0.25 | 0.02 | 0.17 | 0.05 | -0.15 | 0.09 | 0.16 |
| AST | 0.01 | -0.05 | -0.05 | -0.02 | 0.11 | -0.16 | -0.09 | 0.24 | 0.03 | -0.04 | 0.1 | -0.18 | -0.04 | 0.17 | -0.22 | 0.01 | -0.09 |
| BAL | -0.02 | 0.14 | 0.28 | 0.07 | -0.16 | 0.1 | 0.02 | 0.08 | 0.05 | 0.16 | -0.02 | 0.09 | -0.08 | -0.1 | 0.28 | 0.36 | -0.05 |
| CAN | 0.02 | -0.03 | -0.14 | -0.28 | -0.02 | -0.11 | -0.06 | 0.11 | 0.05 | 0.29 | -0.09 | -0.1 | 0.09 | -0.2 | -0.17 | 0.04 | -0.09 |
| CANT | -0.23 | -0.22 | 0.05 | -0.1 | 0.15 | -0.14 | -0.31 | -0.05 | 0.02 | 0.11 | 0.06 | -0.18 | -0.17 | -0.13 | -0.08 | 0 | -0.21 |
| CAT | 0.03 | 0.01 | -0.12 | 0 | -0.09 | -0.1 | 0.09 | -0.06 | 0 | 0.04 | -0.02 | -0.14 | 0.16 | 0.04 | -0.19 | -0.23 | -0.02 |
| CLM | 0.14 | 0.13 | 0.02 | 0.26 | 0.06 | -0.16 | -0.03 | -0.09 | 0.24 | 0.18 | -0.09 | -0.02 | 0.33 | -0.29 | 0.08 | -0.17 | 0.02 |
| CYL | 0.13 | 0.16 | 0.01 | 0.11 | 0.29 | -0.02 | 0.04 | 0.19 | 0.18 | 0.18 | 0.16 | 0 | 0.11 | 0.03 | -0.18 | 0.15 | 0.12 |
| EXT | 0.04 | 0 | 0.1 | 0.36 | 0.28 | 0.14 | -0.02 | -0.03 | 0.06 | -0.04 | 0.11 | -0.08 | -0.08 | -0.01 | 0.06 | 0.08 | -0.03 |
| GAL | 0.01 | 0.06 | -0.15 | -0.17 | 0.24 | 0.07 | 0.1 | -0.1 | 0.03 | 0.05 | -0.02 | 0.12 | 0.1 | -0.12 | -0.04 | -0.1 | -0.18 |
| MAD | -0.08 | 0.15 | -0.14 | -0.06 | -0.14 | 0.05 | 0.08 | -0.21 | -0.1 | -0.05 | -0.11 | 0.09 | 0.15 | 0.18 | -0.13 | 0.09 | 0.16 |
| MUR | -0.23 | 0.02 | -0.02 | -0.13 | 0.21 | 0.06 | -0.26 | -0.21 | -0.01 | 0.46 | 0.06 | -0.39 | -0.24 | -0.43 | -0.38 | 0.1 | -0.13 |
| NAV | -0.08 | -0.01 | -0.19 | -0.06 | 0.51 | 0.1 | -0.09 | -0.12 | -0.02 | 0.21 | 0.2 | -0.19 | -0.2 | -0.09 | -0.2 | 0.14 | 0.06 |
| PV | -0.13 | 0.13 | -0.06 | -0.15 | -0.15 | 0.19 | 0.09 | -0.12 | -0.05 | -0.05 | -0.07 | -0.1 | -0.09 | -0.15 | -0.3 | -0.17 | -0.13 |
| RIO | -0.11 | -0.1 | 0.2 | 0.18 | -0.01 | 0 | -0.02 | -0.17 | -0.13 | 0.13 | -0.02 | 0.16 | -0.02 | -0.12 | 0.16 | 0.01 | -0.04 |
| VAL | -0.08 | -0.12 | -0.16 | -0.22 | 0.01 | -0.1 | 0.11 | -0.1 | -0.2 | -0.16 | -0.16 | 0.19 | 0.03 | 0.07 | 0.05 | -0.21 | -0.11 |
| GLO | -0.23 | 0.14 | -0.33 | -0.28 | 0.17 | 0.03 | 0.08 | -0.32 | -0.16 | 0.21 | -0.04 | 0 | 0.2 | 0.04 | -0.41 | -0.02 | 0.07 |
| Shock in: | AND | ARA | AST | BAL | CAN | CANT | CAT | CLM | CYL | EXT | GAL | MAD | MUR | NAV | PV | RIO | VAL |
| AND | -0.53 | -0.08 | -0.21 | -0.81 | 0.25 | 0.33 | -0.43 | -0.64 | -0.41 | -0.19 | -0.08 | -0.07 | -0.17 | 0.02 | -0.26 | 0.3 | 0.17 |
| ARA | -0.87 | -0.38 | -0.63 | -0.69 | 0 | -0.15 | -0.94 | -1 | -0.48 | -0.31 | -0.28 | -0.77 | -0.7 | -0.62 | -0.89 | -0.05 | -0.44 |
| AST | -0.45 | -0.42 | -0.44 | -0.34 | -0.55 | -0.63 | -0.7 | -0.29 | -0.19 | -0.29 | -0.34 | -0.79 | -0.6 | -0.48 | -0.83 | -0.19 | -0.66 |
| BAL | -0.42 | -0.19 | -0.02 | -0.03 | -0.51 | -0.29 | -0.5 | -0.37 | -0.15 | -0.11 | -0.24 | -0.43 | -0.53 | -0.54 | -0.08 | 0.15 | -0.53 |
| CAN | 0.11 | 0.12 | -0.12 | -0.24 | 0.13 | 0.11 | 0.11 | 0.19 | 0.04 | 0.36 | -0.05 | 0.15 | 0.23 | 0.17 | 0.07 | 0.14 | 0.11 |
| CANT | -1.27 | -1 | -0.79 | -0.79 | -0.81 | -0.99 | -1.61 | -1.4 | -0.61 | -0.65 | -0.71 | -1.34 | -1.24 | -1.16 | -1.36 | -0.41 | -1.12 |
| CAT | -1.08 | -1.08 | -1.16 | -0.73 | -1.53 | -1.29 | -1.37 | -1.26 | -0.56 | -0.37 | -1.01 | -1.67 | -1.2 | -1.45 | -1.85 | -1.01 | -1.51 |
| CLM | 0.04 | -0.02 | -0.06 | 0.26 | -0.11 | -0.37 | -0.11 | -0.37 | 0.15 | -0.03 | -0.14 | -0.21 | 0.06 | -0.38 | -0.03 | -0.22 | -0.26 |
| CYL | -0.32 | 0.11 | -0.03 | -0.37 | 0.18 | 0.19 | -0.4 | -0.51 | -0.08 | -0.21 | 0.09 | -0.22 | -0.28 | -0.13 | -0.27 | 0.34 | 0.11 |
| EXT | 0.47 | 0.31 | 0.46 | 0.78 | 0.74 | 0.31 | 0.52 | 0.5 | 0.27 | -0.05 | 0.42 | 0.38 | 0.28 | 0.45 | 0.64 | 0.14 | 0.22 |
| GAL | -0.23 | -0.06 | -0.31 | -0.37 | 0.05 | 0.09 | -0.13 | -0.28 | -0.12 | -0.1 | -0.06 | -0.07 | -0.09 | -0.13 | -0.2 | -0.14 | -0.35 |
| MAD | -0.64 | -0.39 | -0.61 | -0.47 | -0.93 | -0.39 | -0.64 | -0.91 | -0.37 | -0.16 | -0.58 | -0.7 | -0.62 | -0.65 | -0.84 | -0.13 | -0.6 |
| MUR | -0.86 | -0.52 | -0.65 | -0.52 | -0.46 | -0.41 | -1.03 | -1 | -0.48 | -0.31 | -0.51 | -1.16 | -0.88 | -0.92 | -1.12 | -0.17 | -0.76 |
| NAV | -0.68 | -0.33 | -0.55 | -0.59 | 0.16 | -0.06 | -0.78 | -0.89 | -0.41 | -0.43 | -0.15 | -0.74 | -0.72 | -0.44 | -0.78 | 0.11 | -0.24 |
| PV | 0.19 | 0.42 | 0.26 | -0.04 | 0.01 | 0.62 | 0.44 | 0.3 | 0.16 | 0.17 | 0.18 | 0.25 | 0.29 | 0.28 | 0.48 | 0 | 0.13 |
| RIO | 0.24 | 0.28 | 0.6 | 0.41 | 0.56 | 0.38 | 0.52 | 0.27 | 0.05 | 0.13 | 0.37 | 0.73 | 0.5 | 0.48 | 0.78 | 0.11 | 0.51 |
| VAL | -0.52 | -0.2 | -0.36 | -0.73 | -0.24 | 0.02 | -0.31 | -0.59 | -0.32 | -0.28 | -0.23 | -0.06 | -0.24 | -0.19 | -0.28 | -0.19 | -0.17 |
| GLO | -2.09 | -1.17 | -1.67 | -1.83 | -1.78 | -0.93 | -2.2 | -2.49 | -1.12 | -0.65 | -1.39 | -2.06 | -1.79 | -1.76 | -2.37 | -0.64 | -1.72 |
Generally, from Table 3, the GVA-weighted average shock shows responses of GVA that are similar to the ranking in the share of national GVA (the greater the share, the more negative the impact; see Figure 1). Some exceptions are the regions that have the largest negative effects, Castile-La Mancha (ninth position within the Spanish ranking considering its share in national GVA) and the Basque Country (fifth position in GVA shares). For Castile-La Mancha, the reason could be the lack of agglomeration derived from the low density that characterizes this region while in the case of the Basque Country, the explanation may lie in its economic and institutional differences from the rest of Spain.
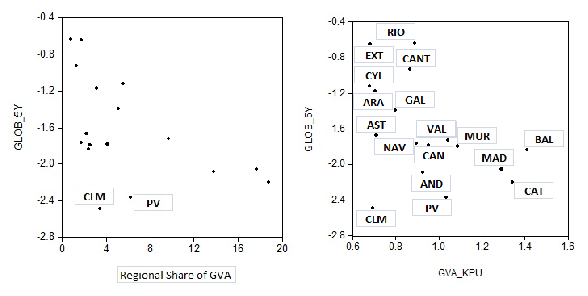
On the other hand, Figure 1 also shows a negative correlation between the economic impact of a negative shock to public capital and the ratio of GVA to public capital. It seems that a negative global shock to public capital will induce higher negative response on GVA when the GVA/Public Capital ratio increases. This negative correlation seems to have little effect on the region Castile-La Mancha, since this region has an existing low ratio and it presents the lowest effect.
Overall, the estimation results suggest that a negative global shock will have a negative effect on the output of every region in Spain. However, global shocks can hide the detection of locations where the spillovers originate. Further, operating only with a global shock does not allow isolation of the effects from a specific region of interest. Consequently, the second shock scenario (a negative unit shock to public capital in each region) is needed in order to identify the regions where further reduction in public capital would have a greater negative impact, a lower negative impact, or even positive effects. Estimations of the domestic and the spillover output effects (from a region on the rest of the system) of one standard error negative shock to public capital in every Spanish region are provided in Tables 2 and 3. These results are new in the literature, since previous studies have only been able to reveal a part of the complex spatio-temporal feedbacks across regions; none of these studies has identified the spatio-temporal interdependencies between the state variables of all the regions.
From the estimates contained in Tables 2 and 3, the domestic and the spillover effects display positive and negative signs. Although negative effects prevail, the existence of positive effects opens a new dimension for the analysis of public investment. As seen in Table 3, for three of the seventeen regions, the domestic effects after five years are positive. Reduced funding for public capital accumulation in the Basque Country, Canary Islands and La Rioja will affect positively their regional economic growth. The underlying explanation might be in the fact that, while public capital formation will raise output directly in these regions (public and private capital are direct substitutes), the existence of a negative effect on the marginal productivity of private capital and employment could counterbalance the positive effects. This way, if increases in public capital imply negative effects on private capital (the direct substitution effects prevails for these regions), regional policy makers would have to implement measures in these regions that favor decreases in public capital. Among the negative domestic effects, Catalonia is the region with the lowest value; it is the most sensitive regional economy to a negative unit shock in public capital.
With respect to the spillover effects shown in Table 3, it is also possible to find positive and negative effects. From the responses, it is important to highlight the existence of asymmetric shocks, ones that affect a pair of regions in a dissimilar way11 . For example, a negative unit shock in the Valencian Community has negative effects on Andalusia, while a negative shock in Andalusia has a positive effect on Valencian Community. Another example is the case of the estimated effects between Catalonia and the Basque Country. For explanation, and in line with the applied methodology, it is not possible to rely on the nature of trade between these regions since the results are derived from a complicated process involving the tracing of paths of influence throughout the system.
Any attempt to analyze these spillovers will require the calculation of the average effects generated “from a region to the rest” (outward effects) and “from the rest to a region” (inward effects). The outward (inward) mean effects are computed from Table 3 by rows (columns) as weighted averages based on the regional shares of national GVA. The results are shown in Table 4. From columns 5 and 6 of this table, the estimation results show some evidence of the relative contribution of spillover effects on domestic effects. Ten of the Spanish regions (59%) have outward effects that are smaller than the corresponding domestic (internal) effects. In turn, for nine of the seventeen regions (53%), inward effects of public capital installed outside each region are more relevant than the domestic effects of public capital installed in the region.
| Mean | Mean | Mean | Mean | ||
| Outward | Inward | Outward | Inward | ||
| Regions | Domestic | Effects | Effects | Effects / | Effects / |
| Effects | (Weighted | (Weighted | Domestic | Domestic | |
| Average | Average | Effects | Effects | ||
| by GVA) | by GVA) | ||||
| AND | -0,53 | -0,18 | -0,94 | 0,35 | 1,78 |
| ARA | -0,38 | -0,69 | -0,11 | 1,82 | 0,28 |
| AST | -0,44 | -0,58 | -0,10 | 1,32 | 0,24 |
| BAL | -0,03 | -0,38 | -0,14 | 12,69 | 4,65 |
| CAN | 0,13 | 0,10 | -0,15 | 0,77 | -1,18 |
| CANT | -0,99 | -1,21 | -0,02 | 1,22 | 0,02 |
| CAT | -1,37 | -1,30 | -1,19 | 0,95 | 0,87 |
| CLM | -0,37 | -0,09 | -0,29 | 0,25 | 0,79 |
| CYL | -0,08 | -0,19 | -0,21 | 2,43 | 2,59 |
| EXT | -0,05 | 0,44 | -0,05 | -8,80 | 1,02 |
| GAL | -0,06 | -0,16 | -0,19 | 2,68 | 3,13 |
| MAD | -0,70 | -0,62 | -1,16 | 0,89 | 1,65 |
| MUR | -0,88 | -0,86 | -0,14 | 0,98 | 0,16 |
| NAV | -0,44 | -0,57 | -0,10 | 1,29 | 0,22 |
| PV | 0,48 | 0,25 | -0,50 | 0,52 | -1,05 |
| RIO | 0,11 | 0,48 | -0,01 | 4,32 | -0,11 |
| VAL | -0,17 | -0,29 | -0,56 | 1,72 | 3,28 |
The lowest negative outward effects can be found in Catalonia and Cantabria. Conversely, the highest positive effects (push-out growth spillovers) emanate from La Rioja, Extremadura and the Basque Country. Considering the range of values obtained by the domestic effects (X-axis) and the outward effects (Y -axis), different categories of regions can be depicted. Table 5 provides a taxonomy of the Spanish regional economies, highlighting the way in which reductions in public capital operate; different clusters of regions are observed And the classification of Table 5 generates some unexpected findings. For instance, negative shocks in the public capital of Cantabria, Catalonia and Murcia have more serious implications than others since they will produce important negative effects not only on their own regions but their corresponding trade-related regions. On the other hand, Canary Islands, Extremadura, the Basque Country and La Rioja are regions where the impact of austerity measures on public investment will produce lower negative effects than in the rest of regions.
Finally, Table 6 presents another taxonomy of the Spanish regional economies in view of the range of values obtained by the domestic effects (X-axis) and the inward effects (Y -axis). The different categories of regions recognize the importance of regional economic size in the generation of these effects, since all the regions, except the five largest regional economies (Catalonia, Madrid, Andalusia, Valencian Community and the Basque Country), have push-in effects above the mean. However, the larger regional economies are more sensitive to the negative shocks in public capital in the rest of regions.
| Mean | 0.47 | CLM | CAN, EXT, PV, | |
| Outward | RIO | |||
| Effects | ||||
| -0.11 | ||||
| AND, ARA, AST, | BA, CL, GA | |||
| VAL, MAD, NAV | ||||
| -0.7 | ||||
| CANT, CAT, | ||||
| MUR | ||||
| -1.3 | ||||
| -1.37 -0.75 -0.13 0.48
| ||||
| Domestic Effects
| ||||
| Mean | -0.01 | CANT, MUR | CLM, AST, NAV, | CAN, EXT, RIO, |
| Inward | ARA | GA, CL, BA | ||
| Effects | ||||
| -0.40 | ||||
| VAL | PV | |||
| -0.79 | ||||
| CAT | MAD, AND | |||
| -1.19 | ||||
| -1.37 -0.75 -0.13 0.48
| ||||
| Domestic Effects
| ||||
The foregoing analysis suggests that a global reduction in the level of public capital stock will generate important implications for regional growth, and it is crucial, in designing regional growth-promoting strategies, to account for the variety of spatio-temporal effects through which regional public investment affect the rest of the regional economies.
5.1 Policy implications
From the economic literature, it would be expected that public investment in core regions
would produce positive effects on regional growth due to the higher efficiency of
investment in these type of regions (e.g. Caminal 2004), suggesting that regional
public capital expenditure should be channeled to more developed regions (Bla ek,
Mace
ek,
Mace ková 2010). For the Spanish case, De la Fuente (2004, p. 502) recommends
investing “… a lot more in some of the richest regions and considerably less in some
of the poorest ones.” Nevertheless, the uneven distribution of public investment,
favoring only developed regions, could produce negative results in terms of regional
equity.
ková 2010). For the Spanish case, De la Fuente (2004, p. 502) recommends
investing “… a lot more in some of the richest regions and considerably less in some
of the poorest ones.” Nevertheless, the uneven distribution of public investment,
favoring only developed regions, could produce negative results in terms of regional
equity.
In view of the previous results, some policy implications can be suggested that will have implications for regional growth strategies. Taking account of the current public financial difficulties, the results suggest that decisions about the allocation of regional public investments can affect regional economic growth. The detected effects of public capital on regional growth indicate that some regions act as key generators of economic activity within the Spanish regional economic system.
From a policy standpoint, this new approach can provide some important insights. First at all, a negative global shock to public capital in Spain (first scenario) would not be a prudent development, since all the regions will suffer a decrease in regional growth. Secondly (second scenario), a key policy lesson also is that regional economic policy should not underestimate the benefits of maintaining levels of public capital in some regions: when the contribution to regional economic growth may be compromised in terms of system-wide effects (rather than just in a single region), it would be necessary to maintain public investments in these key regions. On the other hand, there are some options for reductions in public capital in the regions where public capital resources are going to be underused in terms of their contribution to regional economic growth. However, data on the effective utilization of existing capital stock are not available.
On the other hand, some important findings can be highlighted with respect to the reciprocal contributions between Catalonia and the rest of the Spanish regions. First, negative shocks in public capital of the rest of the Spanish regions produces negative effects (above the mean) in Catalonia. Thus, Catalonia is within the group of Spanish regions that are more sensitive to the negative shocks in public capital of the rest of the Spanish regions, and this indicates a higher dependence of Catalonia on the rest of Spain. Secondly and at the same time, negative shocks in the public capital of Catalonia have more serious implications than negative shocks in other regions. The conclusion is that our analysis of reductions in public capital in the Spanish regional economic system indicates that Catalonia occupies the first place among the most sensitive regional economies in Spain; Catalonia belongs to the group with lower spillover effects, and it is the region with the lowest inward effect.
6 Final remarks and conclusions
Public capital is shown to be a significant determinant of regional output growth. People, private capital and other regional factors are mobile across regions, and trade will connect regions, generating variations in the responses to public capital provision both in the short- and long-run. Nevertheless, neither of the dominant methods of analyzing the impact of public investments within a regional economic system considers the possibility that regional responses reflect in part the changes in public capital in other region(s). In this paper, an empirical framework is used that links the allocation of regional public investment with regional economic growth.
The aim of this research has been to implement a quantitative approach to guide and prioritize public investment within a closed regional economic system. The performance of the Spanish regions has been evaluated through the assessment of how output in every region within the country is affected by a reduction in the public capital stock of another specific region. This procedure can be considered as a simulation of the impact of austerity measures on public expenditure of the Spanish central and regional governments.
To accomplish this task, a multiregional integrated method has been used to investigate the regional growth effects of public capital in Spain. The specified MultiREG-SpVAR model facilitates addressing many of the econometric criticisms of the previous literature. In fact, the traditional VAR framework so often used in the empirical analysis excludes the presence of spatial feedbacks among the relevant variables of the regions.
The contribution to the literature is twofold. First, in contrast to existing studies that estimate ‘local’ VAR models, a ‘global’ VAR specification is used to test the effect of a reduction (although in other economic circumstances it could have been an increase) in the stock of public capital, accounting for heterogeneity, simultaneity and spatial autocorrelation. This econometric approach provides the opportunity to identify both domestic and spillover effects of a reduction in public capital on regional output growth. Secondly, the analysis moves beyond most existing cross-section studies by providing more information about the location where the spillover effects originate. These contributions allow identification of regions in which further public capital reduction (increase) would have a lower (greater) effect on the output.
In particular, the responses of regional outputs to a negative unit shock in regional public capital have been analyzed using two different scenarios: a) a negative global shock to public capital in Spain; and, b) a negative unit shock to public capital in each region. From the first scenario, the detected effects appear quite plausible; the results show that reduced funding for public capital accumulation will negatively affect the economic growth of all the regions. The conclusion is that global decreases in public investment have a homogeneously negative effect on the output of all the regions. From the second scenario, the domestic and the spillover effects display positive and negative signs. Although negative effects prevail, the existence of positive effects can guide regional public capital allocation, prioritizing regional investment.
The empirical analysis reveals the existence of different clusters of regions. From this taxonomy, some regions facing substantial cuts in public investment may be able to maintain a modest level of regional growth over time. On the other hand, the diminution of public capital in other regions will negatively affect the regional economic system. In other words, the Spanish regions portray heterogeneous responses from localized public capital reductions over the years considered. This means that there is a place for strategic, planning actions from policy-makers in Spain to improve the allocation of public resources: it may be possible to partially mitigate the impact of austerity measures on government spending through a more considered, spatially targeted strategy. However, such a strategy presents significant political challenges to a central government interested in balancing concerns with national growth and development with attention to regional equity.
Although the findings in this paper make an important contribution to the ongoing debate about which regional policies need to be promoted to raise and sustain Spanish regional economic growth, some cautionary remarks seems appropriate. First, the analysis was conducted at the regional level; it would be interesting to considerer a multilevel analysis, since, at a lower level of disaggregation, regional responses may be even more heterogeneous and with a concomitant increase in spillovers. Disaggregation of public capital into its main components might also reveal some greater variations. At the same time, some integration of this modeling approach inside a multiregional general equilibrium model might enhance the understanding of the full system-wide impacts, especially the ways in which reductions in public investment affect employment levels, consumption, production, and government revenues.
Acknowledgement
We thank the editor and two anonymous referees for their comments. The authors acknowledge financial support from the Spanish Ministry of Economy, Industry and Competitiveness (Grant ECO2016-78352-P).
References
Agénor PR, Moreno-Dodson B (2006) Public infrastructure and growth: New channels and policy implications. Policy research, working paper, no. 4064, world bank. CrossRef.
Aschauer DA (1989) Is public expenditure productive? Journal of Monetary Economics 23[2]: 177–200. CrossRef.
Baxter M, King RG (1993) Fiscal policy in general equilibrium. The American Economic Review 83[3]: 315–334
Bla ek J, Mace
 ková M (2010) Regional analysis of public capital expenditure:
To which regions is public capital expenditure channelled – to ’rich’ or to ’poor’ ones?
Regional Studies 44[6]: 679–696. CrossRef.
ková M (2010) Regional analysis of public capital expenditure:
To which regions is public capital expenditure channelled – to ’rich’ or to ’poor’ ones?
Regional Studies 44[6]: 679–696. CrossRef.
Boarnet MG (1998) Spillovers and locational effects of public infrastructure. Journal of Regional Science 38: 381–400. CrossRef.
Bustos A, Cutanda A, Díaz A, Escribá FJ, Murgui MJ, Sanz MJ (2008) La BD.MORES en base 2000: nuevas estimaciones y variables. Working paper d-2008-02, dirección general de presupuestos, ministerio de economía y hacienda
Caminal R (2004) Personal redistribution and the regional allocation of public investment. Regional Science and Urban Economics 34[1]: 55–69. CrossRef.
Capello R (2009) Spatial spillovers and regional growth: a cognitive approach. European Planning Studies 17: 639–658. CrossRef.
Cheshire P, Carbonaro G (1996) Urban economic growth in Europe. Urban Studies 33: 1111–1128
Chung S, Hewings GJD (2015) Competitive and complementary relationship between regional economies: A study of the Great Lake States. Spatial Economic Analysis 10: 205–229. CrossRef.
Cohen J, Morrison Paul C (2007) The impacts of transportation infrastructure on property values: A higher-ordered spatial econometrics approach. Journal of Regional Science 47[3]: 457–478. CrossRef.
De la Fuente A (2004) Second-best redistribution through public investment: a characterization, an empirical test and an application to the case of Spain. Regional Science and Urban Economics 34: 489–503. CrossRef.
De la Fuente A (2010) Infrastructures and productivity: an updated survey. UFAE and IAE working paper 831.10, Unitat de Fonaments de l’Anàlisi Econòmica (UAB) and Institut d’Anàlisi Econòmica (CSIC)
Dees S, Di Mauro F, Pesaran MH, Smith LV (2007) Exploring the international linkages of the euro area: a global VAR analysis. Journal of Applied Econometrics 22: 1–38. CrossRef.
Deliktas E, Önder A, Karadag M (2009) The spillover effects of public capital on the Turkish private manufacturing industries in the geographical regions. The Annals of Regional Science 43[2]: 653–378. CrossRef.
Deno K (1988) The effects of public capital on U.S. manufacturing activity: 1970 to 1987. Southern Economic Journal 53: 400–411. CrossRef.
Destefanis S, Sena V (2005) Public capital and total factor productivity: New evidence from the Italian regions 1970-98. Regional Studies 39[5]: 603–617. CrossRef.
Devarajan S, Swaroop V, Zou HF (1996) The composition of public expenditure and economic growth. Journal of Monetary Economics 37: 313–344. CrossRef.
Dietzenbacher E, van der Linden JA, Steenge AE (1993) The regional extraction method: EC input-output comparisons. Economic Systems Research 5: 185–206. CrossRef.
Garcia-Mila T, McGuire TJ, Porter RH (1996) The effect of public capital in state-level production functions reconsidered. The Review of Economics and Statistics 78[1]: 177–180. CrossRef.
Gramlich EM (1994) Infrastructure investment: a review essay. Journal of Economic Literature 32[3]: 1176–1196
Heintz J (2010) The impact of public capital on the US private economy: new evidence and analysis. International Review of Applied Economics 24[5]: 619–632. CrossRef.
Henderson D, Kumbhakar S (2006) Public and private capital productivity puzzle: A nonparametric approach. Southern Economic Journal 73[1]: 219–232. CrossRef.
Holtz-Eakin D (1994) Public-sector capital and the productivity puzzle. The Review of Economics and Statistics 76[1]: 12–21. CrossRef.
Holtz-Eakin D, Schwartz A (1995) Spatial productivity spillovers from public infrastructure: Evidence from state highways. International Tax and Public Finance 2: 459–468. CrossRef.
Hunt C (2012) The interaction of public and private capital: a study of 20 OECD members. 44: 739–764. CrossRef.
Kamps C (2005) The dynamic effects of public capital: VAR evidence for 22 OECD countries. International Tax and Public Finance 12[4]: 533–558. CrossRef.
Koop G, Pesaran MH, Potter SM (1996) Impulse response analysis in nonlinear multivariate models. Journal of Econometrics 74: 119–147. CrossRef.
Llano C, Esteban A, Pérez J, Pulido A (2008) La base de datos C-intereg sobre el comercio interregional de bienes en España: método y primeros resultados (1995-2006). Ekonomiaz 69[3]: 245–269
Llano C, Esteban A, Pérez J, Pulido A (2010) Opening the interregional trade black box: The C-Intereg database for the Spanish economy (1995-2005). International Regional Science Review 33[3]: 302–337. CrossRef.
Álvarez A, Arias C, Orea L (2006) Econometric testing of spatial productivity spillovers from public capital. Hacienda Pública Española 178[3]: 9–21
Lynde C, Richmond J (1992) The role of public capital in production. Review of Economics and Statistics 74: 37–44. CrossRef.
Mas M, Pérez F, Uriel E (2009) El stock y los servicios del capital en España y su distribución territorial. Fundación BBVA-Ivie
Mas M, Pérez F, Uriel E (2011) El stock y los servicios del capital en españa y su distribución territorial y sectorial (1964-2010). Technical report
McGregor PG, Swales JK (2003) The economics of devolution/decentralisation in the UK: Some questions and answers. Discussion paper in economics 03-13, University of Strathclyde, Glasgow (http://www.strath.ac.uk/media/departments/economics/researchdiscussionpapers/2003/media_34453_en.pdf)
Melitz MJ, Ottaviano GIP (2008) Market size, trade, and productivity. Review of Economic Studies 75: 295–316. CrossRef.
Moreno R, López-Bazo E (2007) Returns to local and transport infrastructure under regional spillovers. International Regional Science Review 30: 47–71. CrossRef.
Morrison P, Schwartz A (1996) State infrastructure and productive performance. The American Economic Review 86[5]: 1095–1111
Márquez MA, Ramajo J, Hewings GJD (2010a) Measuring the spillover effects of public capital: A bi-regional structural vector autoregressive analysis. Letters in Spatial and Resource Sciences 3: 111–125. CrossRef.
Márquez MA, Ramajo J, Hewings GJD (2010b) A spatio-temporal econometric model of regional growth in Spain. Journal of Geographical Systems 12: 207–226. CrossRef.
Márquez MA, Ramajo J, Hewings GJD (2011) Public capital and regional economic growth: a SVAR approach for the Spanish regions. Investigaciones Regionales 21: 199–223
Márquez MA, Ramajo J, Hewings GJD (2015) Regional growth and spatial spillovers: Evidence from an SpVAR for the Spanish regions. Papers in Regional Science 94: S1–S18. CrossRef.
Munnell A (1990) Why has productivity declined? Productivity and private investment. New England Economic Review, Federal Reserve Bank of Boston, January-February (https://www.bostonfed.org/-/media/Documents/neer/neer190a.pdf)
Pereira AM, Roca-Sagalés O (2003) Spillover effects of public capital formation: Evidence from the Spanish regions. Journal of Urban Economics 53: 238–256. CrossRef.
Pesaran MH, Schuermann T, Weiner SM (2004) Modelling regional interdependencies using a global error-correcting macroeconometric model. Journal of Business and Economic Statistics 22[2]: 129–162. CrossRef.
Pesaran MH, Shin Y (1998) Generalized impulse response analysis in linear multivariate models. Economic Letters 58: 17–29. CrossRef.
Ramajo J, Márquez MA, Hewings GJD (2017) Spatiotemporal analysis of regional systems: A multiregional spatial vector autoregressive model for Spain. International Regional Science Review 40: 75–96. CrossRef.
Ratner JB (1983) Government capital and the production unction for U.S. private output. Economics Letters 13: 213–217. CrossRef.
Roca-Sagalés O, Sala H (2006) Efectos Desbordamiento de la Inversión en Infraestructuras en las Regiones Españolas. Investigaciones Regionales 8: 143–161
Romp W, De Haan J (2007) Public capital and economic growth: A critical survey. Perspektiven der Wirtschaftspolitik 8: 6–52. CrossRef.
Seitz H (1993) A dual economic analysis of the benefits of the public road network. The Annals of Regional Science 27[3]: 223–239. CrossRef.
Seitz H, Licht G (1995) The impact of public infrastructure capital on regional manufacturing production cost. Regional Studies 29: 231–240. CrossRef.
Serrano Martínez L, Mas Ivars M, Pérez García F, Uriel Jiménez E (2017) Acumulación y productividad del capital en España y sus comunidades autónomas en el Siglo XXI. Fundación BBVA, Bilbao
Sims CA (1980) Macroeconomics and reality. Econometrica 48[1]: 1–48. CrossRef.
Sturm JE, Kuper GH, de Haan J (1998) Modelling government investment and economic growth on a macro level: a review. In: Brakman S, van Ees H, Kuipers SK (eds), Market Behaviour and Macroeconomic Modelling. MacMillan Press Ltd, London, 359–406. CrossRef.
Tatom J (1991) Public capital and private sector performance. Federal Reserve Bank of St.Louis Review 73: 3–15
Young A (1991) Learning by doing and the dynamic effects of international trade. Quarterly Journal of Economics 106: 369–405. CrossRef.
Yu N, de Jong M, Storm S, Mi J (2013) Spatial spillovers of transport infrastructure: evidence from Chinese regions. Journal of Transport Geography 28: 56–66. CrossRef.