 Volume
4, Number 1, 2017, 51-70 journal homepage:
region.ersa.org
Volume
4, Number 1, 2017, 51-70 journal homepage:
region.ersa.orgDOI: 10.18335/region.v4i1.118
Critical Performance Factors for Large World Cities – In Search of Qualitative Causal Patterns by means of Rough Set Analysis*
1 KTH Royal Institute of Technology, Stockholm, Sweden; Adam Mickiewicz University, Poznan, Poland (email: karima.kourtit@abe.kth.se)2 Tinbergen Institute, Amsterdam, The Netherlands; Adam Mickiewicz University, Poznan, Poland; KTH Royal Institute of Technology, Stockholm, Sweden (email: pnijkamp1@gmail.com) Received: 9 January 2016/Accepted: 8 March 2017
*This paper was inspired by several studies that have been produced in the context of the Joint Programming Initiative ‘Urban Europe’ (see also Arribas-Bel et al. 2013). It is devoted to one of the icons in regional science, Manfred Fischer.
Abstract. In the currently emerging ‘urban century’, large cities and urban agglomerations are increasingly turning into (socio-)economic and political powerhouses of world-wide importance. This paper offers a comparative assessment of the multidimensional performance profile of major cities in our world, with particular emphasis on the livability and economic potential of these cities. We use an explanatory cohesive framework in the present study, which finds its origin in the so-called ‘urban piazza’ model. Next, using an extensive database on various rankings of 40 global cities (the so-called GPCI data base), the relative performance of these cities is ‘explained’ in a qualitative sense by means of a non-parametric ordinal ranking method, known as rough set analysis. The approach allows us to identify in a qualitative sense the driving forces that altogether are responsible for the economic and livability achievements of these cities. Our analysis is based on a novel triple-layer rough set analysis of the performance of the cities concerned. The empirical analysis highlights the combined explanatory ‘power’ of several success conditions and drivers of the cities concerned. Our empirical results demonstrate that in particular geographical accessibility and R&D of these urban areas appears to play in many cases an important role in shaping their strong position.
Key words: urbanization; cities; performance; rough set analysis; piazza model
1 The Urban Planet
Demographic changes will be decisive for the future geography of our world (Tellier 2007). According to UN projections, our planet will house approx. 9 bln people by the year 2050. The rise with some 2.5 to 3.0 bln humans in the next 35 years – a time span covering a little bit more than one generation – is however, not equally spread over the world. There are significant regional differences, with a massive expected population rise in Africa, Asia and Latin America.
Another inevitable demographic megatrend for the decades to come is the massive population drift to the city. Cities will grow bigger – or rise in numbers – not only due to the global population rise, but also as a result of movements of people from peripheral and rural areas to urban agglomerations. There is a general consensus that the rate of urbanization is growing faster than the global population rise, so that our planet will become urban in nature1 (see for more details also Kourtit 2014, 2015).
The above sketched rapid urbanization development will take place in particular in the developing world, so that growth of urban agglomerations will become a dominant characteristic of settlement patterns in the Third World. Other regions will be less affected by the disproportionally fast urbanization, while some regions (e.g., in Japan, Germany, Italy, Poland) may even face situations of shrinking cities (see also Kourtit 2015).
This study aims to provide a new urban analytics for tracing the determinants of the economic (market attractiveness, economic vitality, business environment) and livability (working, cost of living, security, life support functions) achievement of large cities in our world, based on a ‘big data’ system for these cities. This urban performance analysis is undertaken at the level of both aggregate and fine-gained data on these cities.
Large cities are, in general, powerful and effective growth engines in a modern global world. The rising importance of urban agglomerations emerges from so-called agglomeration externalities, partly in the form of MAR (Marshall-Arrow-Romer) externalities, and partly in the form of social network (or Jacobs ‘melting pot’) externalities of urbanization. Nonetheless, the relative efficiency of cities (in terms of productivity, resource use etc.) may differ significantly, and hence it is a matter of empirical research to trace which city has the highest performance and under which conditions (see also Kourtit 2014, 2015).
The emerging new urbanization patterns that manifest themselves world-wide prompt an avalanche of new policy and research challenges and concerns. Particularly in such domains as income distribution, climate change, quality of life, food, energy, safety, mobility, poverty and social cohesion, major problems in cities are expected. In the developing world, it is foreseen that housing problems – in particular, slums – will continue to exist and will have a detrimental effect on the daily well-being of a significant share of the world population. Even more severe problems are anticipated for the decades to come: sea level rise, floods, social tensions, refugee flows, extreme weather conditions, traffic deadlocks, and so forth. It goes without saying that ideally urban economic development has to proceed in tandem with urban ecological sustainability. At present, more than 75 percent of the global environmental impacts are produced by just over 50 percent of the world population, leaving behind a threatening ecological footprint. Is economic growth and productivity able to cope with these issues? Such major and world-wide concerns call for strict governance systems and response mechanisms, but this is exactly the Achilles heel of modern urban planning and policy-making. Clearly, we also need reliable and comparable databases on urban development and their backgrounds, in order to develop effective policy intervention tools (Batty 2013, Vaz 2016, Vaz, Arsanjani 2015, Vaz et al. 2015).
Fortunately, we observe nowadays a renewed and world-wide interest in urban challenges and responses, as well as in the strategic position of world cities in global networks (see Neal 2012, Taylor 2004). Major issues in this debate are:
- The impact of population dynamics on urbanization patterns (in particular, cross-border migration movements).
- The relationship between economic cycles and urban developments (including shrinking cities, such as Detroit or Leipzig).
- The acceleration in urbanization rates in the developing world, and the far-reaching consequences for the economy, society and ecology.
- The serious risks encountered by massive population concentrations, which may be subjected to major catastrophes (e.g., floods, social unrest, extreme weather conditions, terrorism, power cuts).
- The persistent – and sometimes sharpening – poverty traps in many large agglomerations in our world.
- The logistic control of extremely complex urban physical and virtual networks (e.g., commodity distribution, mass transit, volatility of geographic locations, digital data management for public policy etc.)
- The span of control of modern urban governance systems in the management and strategy development of the rising number of mega-cities on our planet.
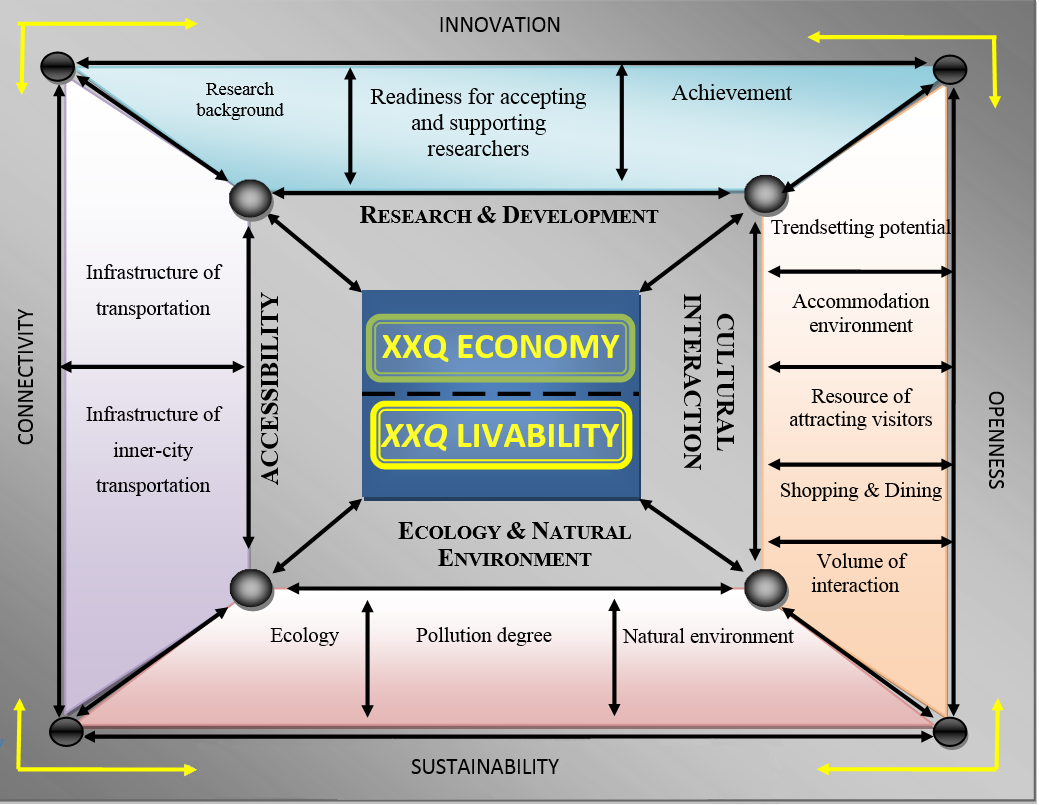
It is clear that modern large cities are complex spatial entities, with a great heterogeneity in socio-economic, transport, business and ecological outcomes. Several cities appear to have a much better performance net outcome than others. And therefore, it is important to trace the drivers of the achievement levels of large cities in our world. It is clear that economic outcomes need to be explained from a broader perspective, while also the quality of life plays an important role. The theoretical underpinning of the design of our research can be found in the ‘urban piazza’ model in Figure 1, to be highlighted in Section 2.
Clearly, the great challenge for large cities in our world is to perform much better. Many cities in our world face sometimes similar, sometimes different problems in achieving a respected and recognized international profile. We talk more and more about global urban competition and competitiveness profiles of cities. This so-called ‘rat race’ (Kourtit, Nijkamp 2013b, Kourtit, Nijkamp, Suzuki 2013) does not mean that cities are in all respects competitors which operate on a ‘predator-prey’ basis, but it suggests that many world cities aim to reach a top position in a global competitive ranking system. The aim of the present paper is now to offer a methodology for comparing in a logical and systematic way a broad range of qualitative performance2 indicators of a set of global cities, in total 40 in number. This comparative study uses a very extensive and rich database from the Global Power City Index system developed by the Japanese Mori Memorial Foundation (2012). This dataset comprises detailed information on numerous indicators for the cities under consideration. In the annual GPCI database reports, a qualitative ranking of these 40 cities – on the basis of their multidimensional performance profile – can be found. The challenging research question in this paper is now whether in a systematic way the determinants for the performance ranking of these cities can be identified. Given the qualitative rank-order information on the determinants, a combinatorial deterministic method will be used, so that factors that are of critical importance (i.e., necessary conditions) for the economic and ecological performance of cities can be traced. The comparative assessment methodology employed here originates from an artificial intelligence method, coined rough set analysis, which is very appropriate in assessing the critical success conditions (stimuli) that lead to a set of output indices (responses) from a number of competitors or alternative choice possibilities. This method which finds its origin essentially in ordinal multi-criteria analysis will concisely be presented in Subsection 2.2.
The paper is organized as follows. Section 2 will be devoted to the description of the framing and the database of our study. Then in Section 3, the operational methodology employed will be briefly outlined, and will offer an overview and interpretation of the empirical results. Section 4 will then conclude with some retrospective and prospective remarks.
2 Framing of the Research
2.1 Description of the database
The rising interest in city growth and size and in urban networks has in recent years prompted a wide variety of city concepts, such as smart city, global city, world city, mega-city, metropolis, ecumenopolis, megalopolis, connected city etc. (Doel, Hubard 2002, Kourtit, Nijkamp 2013b, Neal 2012, Sassen 1991, Taylor 2004). They all have different meanings, but are also often used interchangeably in the literature. In the present paper we will use the neutral term large city, which may in general means that the city concerned – or the urban agglomeration – will have more than 1 mln inhabitants. Our interest is not in conceptual purity, but in the analytical question: what makes the difference? In other words, if a given large city can be characterized by a set of manifold performance indicators, which are the conditioning variables (critical success factors) that determine in a relative sense the success of the city at hand, and to what extent?
Clearly, in principle, the number of performance criteria, as well as the number of drivers (inputs or stimuli) is vast, while sometimes the distinction between drivers and output is not clear at all. Very often, economic characteristics – for instance, number of headquarters of international banks, financial services, international events or exhibitions, or economic image – are seen as performance variables (outputs), while public investments – e.g., international transport infrastructure, advanced IT networks, health care facilities – are often regarded as support conditions that may act as drivers (or inputs). But in a way, they might also partly be seen as endogenous success indicators. Thus, there will always be some ambiguity in the definition of drivers and responses (Kourtit 2015).
In our applied analysis, we will use the extensive and unique multi-dimensional database developed by the Institute for Urban Strategies (Mori Memorial Foundation 2012), which contains a systematically collected and annually updated vast amount of interesting urban data (starting from 2008) that are relevant for our purposes. The data base comprises 40 large cities, with a fair distribution between developing and developed countries. The data is a mix of survey data and ordinal response and perception data. This data base is subdivided into six main categories: Economy, Research & Development, Cultural Interactions, Livability, Environment, and Accessibility. These six categories in the database are next decomposed into a total of 69 empirically tested and mutually comparable sub-indicators for each of the 40 large cities in the world that are considered. This list of preselected cities is a priori given for our analysis; see Figure 2 for this complete list. A very interesting characteristic is also that the database considers the classes of relevant global and local actor-specific scores and rankings of the socio-economic performance of cities from the perspective of prominent stakeholders, in particular, residents, visitors, artists, researchers, and managers (see also Arribas-Bel et al. 2013, p. 252). This is thus a rich and original database, which is particularly suitable for applied comparative research on urban performance.
The GPCI database is based on a cross-section of identifiers of urban development, based on interviews and data collections from local stakeholders. Clearly, each city may have its own desired performance profile with unique or place-specific indicators, but in an internationally comparative and competitive benchmark exercise cities have to be compared on common and identical indicators. As in a global force field it is the external world which decides on the successfulness of urban agglomerations.
This Global Power City Index (GPCI) database offers a multidimensional picture of the socio-economic performance and position of different global cities in the world from the perspective of attracting and retaining firms, talent and investment to these cities on the basis of inter alia quality of life, culture and accessibility, complemented with detailed information on the perceptions of relevant groups of stakeholders (see also Tranos et al. 2014). Table 1 offers a brief overview of the main classes of performance indicators derived from the GPCI-2012 data system (see also Arribas-Bel et al. 2013, p. 252). This information is used in the GPCI analysis to create a performance ranking of all 40 cities. The main question is now: What are the drivers of this ranking?
In highlighting the rank orders of the individual urban indicators included in the six main categories used in the GPCI-2012, the information base demonstrates the different strengths of the socio-economic achievement levels of the leading global cities. This rich information base can also help to improve our understanding of the attractiveness of a particular large city (see also Arribas-Bel et al. 2013, p. 252), for instance, through a benchmark analysis. These GPCI-data are updated annually in a careful and reliable way, so that in principle not only a cross-sectional comparison of cities can be made, but also a combined space-time panel assessment. In the present study however, we will limit ourselves to a cross-section assessment of the performance of cities, mainly since the relative changes in urban performance on an annual basis appear to be rather modest.
The data in the GPCI-database have a broad coverage. But they have to be treated in a logical and coherent framework, so as to identify in a systematic and consistent way the determinants and responses of urban systems in a comparative sense. All details on the collection, standardization, definition and geographical scale of the data can be found in the above mentioned GPCI-report. Annex A contains more detailed rankings of these cities on the basis of the above mentioned principles (Arribas-Bel et al. 2013, p. 254).
In explaining in a qualitative sense the rankings of the cities at hand on the basis of their performance profile, we have focused on two categories of responses or achievements, viz. the economic performance and the livability in each of these cities. Consequently, these two categories of endogenous variables are assumed to be determined by a wide range of background variables, so that all remaining indicators are assumed to be driving forces of these achievement rankings of these cities. This will be tested in our empirical work.
The methodological and conceptual framework of our research on the performance of 40 global cities originates from the ‘urban piazza’ architecture (see Figure 1). The ‘urban piazza’ architecture acts here as the integrated conceptual framework and navigation tool for assessing performance criteria of the global cities under varying condition variables (or stimuli). An extensive underpinning and treatment of the ‘urban piazza’ concept can be found in Kourtit (2015); we refer here also to Arribas-Bel et al. (2013) and Kourtit et al. (2014). The essence of the piazza model is that it offers a comprehensive ideal-typical representation of the urban force field that generates the performance of a given city.
Historically, the ‘piazza model’ is essentially based on the general functional coherence of and socio-economic independencies of activities in ancient Italian cities, in which all relevant forces (economic, social, political, logistic, etc.) were coming together in a central place or node which generated the heartbeat of the city concerned. It offers a broad framing of urban functionalities and mechanisms, from which we have selected a limited set of focused variables that are in agreement with the GPCI dataset. In our study, we assume that nowadays four such major drivers can be distinguished, which are of critical importance for two classes of response (or output) variables. The piazza architecture used in the present empirical analysis is therefore, decomposed into four main segments viz., R&D, Cultural Interaction, Environment and Accessibility, which form the four major condition variables to explain separately two major endogenous decision variables (or responses), viz., XXQ Economic Performance and XXQ Livability (see Figure 1). In other words, global cities seek to generate the highest possible productivity and quality of life (similar to the general XXQ-concept, introduced by Nijkamp (2008)) so as to attract and retain creative and talented actors (employees, self-employed people or entrepreneurs, but also residents and visitors) in order to generate positive externalities (Kourtit, Nijkamp 2013a,c).
Thus, the above two XXQ indicators are a measure of global cities’ performance in which inputs or efforts (Cultural Interaction, R&D, Accessibility and Environment) are linked to achievements of the city at hand (e.g., profitability, vitality, sustainability, etc.). Clearly, the piazza concept can be positioned in a broader context of recent spatial growth models (including absorptive capacity) and urban creativity analysis. It is evident that the presence and experience (individual values, preferences and visions) of creative minds can create critical conditions for enhancing the level of attractiveness of cities, leading to a concentration of innovative potential in geographical space (Kourtit, Nijkamp 2013a,b,c,d, Kourtit 2015). The piazza framework will now be used as an integrating basis for a broad urban assessment exercise, with the aim of tracing the roots of the economic success (XXQ Economy) and livability (XXQ Livability) of cities on the basis of their innovative capacity (R&D), cultural ambiance (Cultural Interaction), natural and ecological quality (Environment) and transport access and connectivity (Accessibility). The information contained in Table 1 is partly quantitative, partly qualitative in nature. To avoid an ambiguous analysis of heterogeneous data, all information was consistently translated into rank-order data.
Since the rankings of the 40 cities under investigation are based on multivariate data that are combined to create a qualitative rank order, it is necessary to seek for an analytical explanatory model that is able to encapsulate such qualitative data. Consequently, we need to look for a qualitative explanatory model, known as rough set analysis. This will be outlined in the next subsection.
2.2 Rough set analysis as a research tool
For the analytical part of our qualitative comparative assessment study, a multivariate qualitative classification method, called rough set analysis (RSA), is used. This method is inspired by the artificial intelligence methodology (for more details, see also Pawlak 1991, Pawlak, Slowinski 1996, van den Bergh et al. 1998, Slowinski, Stefanowski 1994, Greco et al. 1997). This approach will be used as the main methodology, in order to offer an explanatory non-parametric and qualitative model for assessing the critical success conditions that lead to a set of output indicators (responses) for each of the rivalry choice options. This rough set method will be applied to operationalize the conceptual piazza model depicted in Figure 1.
RSA is a deterministic method, which is based on combinatorial set theory (see also Baaijens, Nijkamp 1997, p. 11)(see also Baaijens and Nijkamp 1997, p.11), and may be regarded as a qualitative explanatory regression analysis in case of small samples. A disadvantage of a standard regression analysis is that, if the sample size of the model is limited, the reliability of the regression results is rapidly going down, especially in case of a large number of explanatory variables. In addition, in case the relevant variables have only a qualitative or nominal meaning (e.g., tourism loyalty, historical heritage), application of quantitative regression techniques becomes problematic. RSA is particularly suitable in case of qualitative information and small samples (see Kourtit, Nijkamp, van Leeuwen 2013). The main challenge of RSA is to provide an analytical approximation of logically consistent and permissible statements from the acquired available database. It takes for granted the general scope of regression analysis, viz. that a set of condition variables (explanatory variables, stimuli) impact a set of endogenous variables (responses or decision variables). The main idea is then to find out under which conditions the stimuli have a decisive impact on the responses. In contrast to regression analysis where impact coefficients are estimated, rough set analysis – based on qualitative information – then tries to identify the frequencies of occurrences from the data set, with which a set of stimuli exerts an influence on one or more response variables. This means essentially a deterministic analytics in tracing the impact of condition variables on endogenous variables. From this perspective, RSA is much richer in scope than simple correlation or regression analysis, also because it is able to consider simultaneously more than one endogenous variable, as is the case in one study.
The rough set method is thus suitable to deal with compound qualitative information, and offers a consistent description of a set of qualitative variables on the basis of lower and upper approximations in case numerical values of these variables do not exist. This information is considered as a finite set of objects, which can be described through a set of characteristic attributes. These attributes are supposed to construct the available information on the objects (alternatives, items). On the basis of a set of attributes, a rough set approach can categorize phenomena into groups with identical features by considering relevant measurements that may weaken the ‘unobserved heterogeneity’.
RSA is also an original method for dealing with incomplete information patterns, and may therefore be a useful approach for a transversal comparison of urban achievements from a broad multidimensional perspective (see Orlowska 2013). Data reduction is often the main element of RSA, as it allows to identify and represent hidden structures in the data (see also Baaijens, Nijkamp 1997, p. 11). The result of a RSA of a multidimensional data set is ultimately a decision table which forms the basis for deriving deterministic decision rules, which are compatible and logically consistent with the qualitative pattern of the data. The decision rules are normally of a conditional (i.e. ‘if … then …’) nature and indicate also the strength of such conditional statements (i.e., the number of objects – or frequencies – for which this statement is true) (see Kourtit, Nijkamp, van Leeuwen 2013)(see Kourtit et al. 2013b). These expressions describe the associations between the objects considered and their assignment to particular classes (see Pawlak 1991, 1992)(see Pawlak 1991; 1992). We will not provide here an extensive discussion of the many set-theoretical technalities of RSA. Detailed information on RSA both from a conceptual and an applied perspective can be found in Pawlak (1991), Fayyad et al. (1996), Deogun et al. (1997), Famili et al. (1997), Slowinski (1995), van den Bergh et al. (1998), Ziarco (1998), and Wu et al. (2004).
RSA can nowadays be applied by using standardized open access software. The RSA in the present study is performed with the support of the software programme Rough Set Data Explorer (ROSE). This programme is instrumental to calculate the basic minimal covering of conditional statements from a complex dataset.
We will now use the ROSE software here to compare, in a logical and systematic way, the performance indicators of the set of 40 global cities (i.e. the number of objects) from the GPCI data base in terms of 2 output variables (economy, livability) and 4 input variables (accessibility, R&D, cultural interaction, ecological & natural environment) (the number of attributes considered is thus 6), as outlined in Table 1 and Figure 1. In this way, rough set theory helps to provide insight into the multiple achievement categories of objects and to highlight the most prominent factors behind their achievements and performances (see also Baaijens, Nijkamp 1997). RSA provides thus an operational multidimensional classification method that helps identify important critical factors for a systematic performance analysis of competing objects. In the next section, we will present the empirical findings of the rough set analysis applied to the above mentioned GPCI data set.
3 Rough Set Analysis of Composite and Single Drivers of Urban Performance
Following the conceptual model of Figure 1, we have – as mentioned above – chosen to focus on qualitative XXQ Economy and XXQ Livability indicators for the 40 cities under research. The reason for this choice is that these factors are both distinct from each other and can be well explained from a causality perspective by the other four (composite) factors (R&D, Cultural values, Environmental quality and Accessibility). Thus, the aim is to develop a qualitative explanatory model for the case of two types of performance indicators (decision variables) of GPCI cities as a result of the existence and functioning of four types of underlying drivers (condition variables, in rough set terminology). Thus, in fact, the urban piazza framework of Figure 1 is translated into a qualitative causal model explaining (a set of) two endogenous output variables from (a set of) four exogenous explanatory (input) variables. These output and input variables are, in the RSA jargon, often called decision and condition variables, respectively.
Our RSA will be applied in three steps, as shown in Figure 2. In the first step, we only use the main composite variables, both as decision (2) and condition (4) variables, to test globally the causal pattern implied by our conceptual model from Figure 1. In the second step, we will have a closer look at the distinct sub-factors from the 4 condition variables which are the most influential ones for each of the two overall composite factor scores. Finally, in the third step, we will use the most important critical sub-factors that resulted from step 1 and 2 to explain the composite performance factors XXQ Economy and XXQ Livability as decision variables.
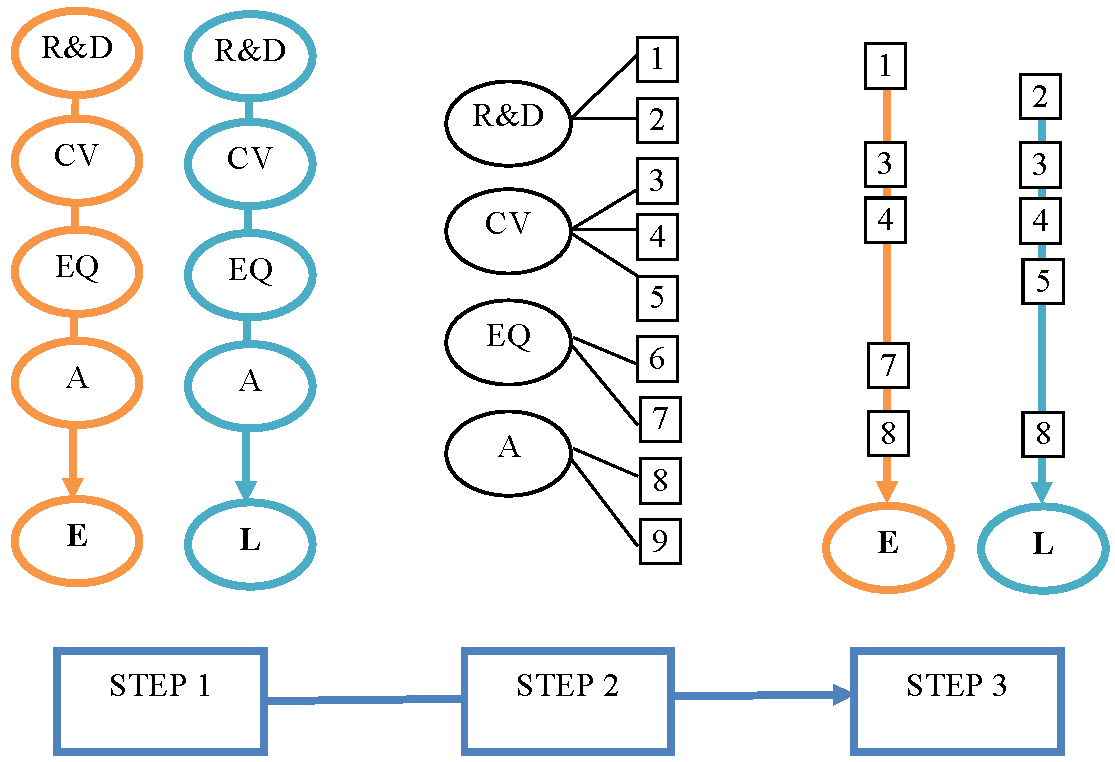
Notes: E = XXQ Economy; L = XXQ Livability; R&D = Research & Development; CV = Cultural Interaction;
EQ = Ecology & Natural Environment; A = Accessibility
3.1 Explaining composite urban performance factors from composite driving forces (Step 1)
In the first step of our analysis we will explore how the 6 composite factors are related to each other. Therefore, the composite economic indicator from Table 1 is used as the decision variable (in rough set terms), to be explained by 4 background variables or condition variables. We classify now the 40 cities from the GPCI data base first into four groups, based on their XXQ Economy indicator. The rankings are denoted as 4 qualitative classes of features, viz. low, medium-low, medium-high and high. The RSA results show that for the XXQ Economy and XXQ Livability scores, all 4 conditional variables appear to be in the ‘core’ of the rough set classification. This means that each of them is relevant and necessary in explaining the level of XXQ Economy. Next, a sensitivity analysis shows that this finding also holds when distinguishing three classes of – rather than four classes – XXQ Economy, so that this result is rather robust.
The quality of classification (viz., in rough set terms, the significance of the combination of background variables playing an explanatory role) appears to be quite high, namely 0.80. With these settings, 8 so-called decision rules or logical statements that are consistent with the data can be derived from the rough set analysis (see Table 2).
| Rule # | R&D | Cultural | Environment | Accessibility | Econ(D) | Coverage (%) |
| 1 | 1 | 1 | 42 | |||
| 2 | 1 | 1 | 29 | |||
| 3 | 4 | 4 | 1 | 29 | ||
| 4 | 1 | 3 | 2 | 22 | ||
| 5 | 3 | 2 | 2 | 29 | ||
| 6 | 2 | 1 | 1 | 2 | 21 | |
| 7 | 3 | 4 | 3 | 42 | ||
| 8 | 2 | 1 | 4 | 3 | 25 | |
The strongest decision rules appear to be rules 1 and 7, which both cover 42% of the dataset. These tell us that a low R&D level results in low economic development; and a medium-low level of R&D combined with a high level of environmental quality results on average in a medium-low economic score for the cities under consideration. There is apparently quite some degree of heterogeneity among the 40 cities in our sample, so that each separate statement from the total set of 8 all rules is somewhat difficult to interpret.
When we apply next a sensitivity analysis and split the cities into 3 groups, with the categories low, medium and high XXQ Economy, again all condition variables appear to be in the core. However, the quality of the classification is slightly lower than before, viz. 0.68 for the economic system (Table 3).
| Rule # | R&D | Cultural | Environment | Accessibility | Econ(D) | Coverage (%) |
| 1 | 1 | 1 | 1 | 77 | ||
| 2 | 1 | 2 | 1 | 46 | ||
| 3 | 2 | 3 | 2 | 2 | 27 | |
| 4 | 3 | 3 | 33 | |||
| 5 | 3 | 3 | 25 | |||
Table 3 shows that the first two rules are the strongest ones, with a coverage of respectively 77 and 46 percent. It is clear that a low R&D, even with a medium accessibility, is related to a low economic performance. Apparently, R&D is a sine non qua for the economic achievements of cities. The other three rules all have a coverage above 25 percent. These indicate that a high level of R&D and a high level of cultural quality are related to high levels of economic performance.
Next, when we take a look at the XXQ Livability scores, again all condition variables appear to be in the core, with a classification quality of even 0.95. This results in a relatively large number of rules, again obtained through using a minimum of 20% of satisfaction (in rough set terms) and always a maximum number of 4 condition variables (see Table 4). Thus, all 4 explanatory factors may be seen as determinants of the urban output variables.
| Rule # | R&D | Cultural | Environment | Accessibility | Livability(D) | Coverage (%) |
| 1 | 3 | 1 | 23 | |||
| 2 | 3 | 2 | 1 | 23 | ||
| 3 | 3 | 1 | 1 | 23 | ||
| 4 | 1 | 1 | 1 | 23 | ||
| 5 | 2 | 1 | 1 | 23 | ||
| 6 | 2 | 2 | 33 | |||
| 7 | 4 | 2 | 2 | 33 | ||
| 8 | 1 | 2 | 2 | 33 | ||
| 9 | 3 | 4 | 3 | 2 | 33 | |
| 10 | 3 | 3 | 4 | 2 | 33 | |
| 11 | 4 | 4 | 3 | 27 | ||
| 12 | 2 | 2 | 4 | 20 | ||
| 13 | 2 | 4 | 4 | 4 | 30 | |
| 14 | 2 | 4 | 3 | 4 | 30 | |
| 15 | 2 | 4 | 3 | 4 | 30 | |
Next, when using again 3 classes of XXQ Livability, again all condition variables appear to be in the core; however, the quality of the classification is a little lower than before, namely 0.40. This also results in a lower number of satisfactory rules, namely only 6, of which 5 deal with low Livability scores. In addition, except for rule 5, all rules have a satisfaction level between 21 and 23%.
| Rule # | R&D | Cultural | Environment | Accessibility | Livability(D) | Coverage (%) |
| 1 | 1 | 1 | 23 | |||
| 2 | 3 | 1 | 1 | 23 | ||
| 3 | 3 | 1 | 1 | 23 | ||
| 4 | 2 | 1 | 1 | 23 | ||
| 5 | 1 | 1 | 1 | 38 | ||
| 6 | 2 | 2 | 2 | 21 | ||
The clearest conclusion from the above results is that low levels of accessibility are related to low Livability scores. This holds for the strongest rule, number 5, with a satisfaction score of 38%, as well as for the 4 subsequent rules. Those first 4 rules indicate that even when levels of R&D or culture are high, but urban accessibility is low, Livability is low. Rule 6 indicates that a medium level of R&D with a medium level of culture is related to medium Livability scores. Clearly, these findings may be seen as rather plausible outcomes.
3.2 Analysis of sub-factors (Step 2)
The dataset we use is a very rich one. The 6 main indicators are grouped into various sub-factors (see Table 1), as are the sub-factors themselves. To see how these sub-sub factors relate to the main indicators, we perform in our rough set approach a heuristic search for reducts (a subset of attributes which can, by itself, fully characterize the information contained in the database) which, in other words, have a basic minimal covering (see also Pawlak 1991, Pawlak et al. 1995, Pawlak, Skowron 2007, Poel 1998, Polkowski 2003). Within the ROSE software program, attributes are added to the existing core by selecting the most promising indicators from this set and by trying different paths. A higher frequency rate means that the sub-factor is more important in explaining the level of the composite score. Appendix A shows the percentages of all sub-factors per composite factor.
First, when looking at the 13 sub-actors of the Economy factor, 5 of them are never part of a minimal reduct. This means that they are the least related to the overall score on the Economy factor. However, 3 of the sub-factors have a score of 100 percent, which means that they are part of all minimal reducts and thus of the core of the dataset. These are: GDP per capita, presence of world top 300 companies, and office area per employee.
Livability is also composed of 13 sub-factors. Of these, 3 have a frequency score of 100 percent. Among those are the number of murders and the variety of shops and restaurants. Apparently, cities with a high degree of criminality can still have a high level of Livability. Furthermore, we can distinguish 1 core variable, namely, maturity of the community. In addition, 2 other variables have a high frequency score: average house rent and medical doctors per inhabitant.
Research and development is composed of 8 sub-factors, which all appear at least once in a minimal reduct. Two of them appear in every reduct and have a 100 percent frequency score; these are: interaction opportunities between researchers, and the number of winners of highly-reputed prizes.
Cultural interaction is composed of the highest number of different sub-factors, viz. 16. Of those, only one half appears in one of the minimal reducts. Three of them are in the core of the dataset: number of theatres and concert halls, number of visitors from abroad, and opportunities of cultural, historical and traditional Interaction.
The next composite factor is Environment, which consists of 9 sub-factors of which as many as four are part of the core. These are: CO2 emissions, density of suspended particulate matter (SPM), level of green coverage, and comfort level of temperature.
The final composite factor is Accessibility. Of the 10 sub-factors, 8 appear once or more times in a minimal reduct. One of them is a core variable, which is punctuality of public transportation. Apparently, this variable is very important in explaining high levels of accessibility. Furthermore, density of metro stations and the presence of direct international freighter flights appears to be also important.
This heuristics search exercise results in an interesting list of 18 single sub-factors that can be used to explain the composite factors XXQ Economy and XXQ Livability (see Table 6). Since 18 condition variables is a high number, we thus perform another heuristic search on the list of most important single factors with either Economy or Livability as decision variables. We selected all variables with a minimal reduct score of 50% and above for the final rule induction (variables are indicated in bold).
| XXQ | XXQ | |
| Economic | Livability | |
| R&D | ||
| Number of Researchers | 34 | 4 |
| World’s Top 200 Universities | 53 | 61 |
| Readiness for Accepting Foreign Researchers | 25 | 100 |
| Cultural | ||
| Number of International Visitors | 88 | |
| Level of Satisfaction for Dining | 25 | 9 |
| Number of Museums | 2 | 22 |
| Number Hotels | 35 | |
| Environment | ||
| CO2 Emissions | 35 | 17 |
| Density of Suspended Particulate Matter (SPM) | 31 | 4 |
| Level of Green Coverage | 51 | 65 |
| Comfort Level of Temperature | 29 | |
|
Number
of
Companies
with
ISO
14001
Certification | 81 | 52 |
|
Density
of
Sulfur
Dioxide
(SO2),
Density
of
Nitrogen
Dioxide
(NO2) | 15 | 87 |
| Percentage of Renewable Energy Used | 41 | 61 |
| Accessibility | ||
| Density of Metro Stations | 80 | 100 |
|
Travel
Time
between
Inner-city
Areas
and
International
Airports | 9 | |
| Number of Passengers on International Flights | 22 | 17 |
| Transportation Fatalities per Population | 20 | |
3.3 Explaining Economy and Livability from the most important critical sub-factors (Step 3)
Finally, the third step of the analysis performed in this study uses the sub-factors that are part of at least one of the minimal reducts. We impose a minimal coverage of 25 percent and a maximum number of attributes of 3 items.
| Rule | Top 200 | Green coverage | Internatio- | Certificates | XXQ Eco- | Coverage |
| Universities | nal visitors | nomy (D) | (%) | |||
| 1 | 1 | 2 | 1 | 31 | ||
| 2 | 1 | 1 | 1 | 1 | 69 | |
| 3 | 1 | 1 | 1 | 1 | 54 | |
| 4 | 2 | 1 | 2 | 60 | ||
| 5 | 2 | 2 | 2 | 27 | ||
| 6 | 3 | 3 | 50 | |||
| 7 | 3 | 3 | 3 | 33 | ||
When looking at the single factors explaining XXQ Economy, there are some interesting findings. Clearly, the presence of good universities appears to be beneficial. A low score for this variable, together with medium/low green coverage and a low number of international visitors, is related to a low score on XXQ Economy. This holds, for example, for Bangkok, Cairo, Fukuoka, Moscow and Mumbai. At the same time, a high score on top-200 universities, together with a high score on certificates, is related to a well performing Economy. This holds for example for Beijing, Hong Kong, London and Tokyo.
In addition, the number of international visitors affects the quality of the economy: rule 6 indicates that cities like Beijing, London, New York, Paris, Sydney and Barcelona, with a high number of international visitors, have a high score on XXQ Economy.
| Rule | Top 200 | Readiness | Green | Dioxide | Renew- | Metro | XXQ | Coverage |
| Univer- | for foreign | coverage | able | Livability | (%) | |||
| sities | researchers | (D) | ||||||
| 1 | 1 | 1 | 31 | |||||
| 2 | 2 | 1 | 31 | |||||
| 3 | 2 | 1 | 2 | 36 | ||||
| 4 | 2 | 1 | 2 | 29 | ||||
| 5 | 1 | 3 | 2 | 29 | ||||
| 6 | 3 | 1 | 2 | 2 | 36 | |||
| 7 | 3 | 3 | 38 | |||||
When looking at Livability, it appears that the urban density of metro-stations has a positive effect. In Beijing, Geneva, Toronto and Zurich the density is low and the livability of medium quality, while in Barcelona, Copenhagen, New York, Paris and Tokyo the density is high, as is Livability. Also the readiness for foreign researchers seems to positively affect XXQ Livability. In Cairo, Moscow, Mumbai and Sao Paulo, for example, this readiness is low, as is the Livability. Green coverage and the presence of top universities shows mixed results. Our hypothesis that the economic and ecological performance of large cities is largely determined by a combination of 4 categories of empirical evidence on 40 large cities is confirmed in our analysis, be it that individual exceptions may occur (just like in any normal regression analysis).
4 Concluding Remarks
In an increasingly urbanized world, cities – or in a more general sense, urban agglomerations – are becoming engines of growth and sustainability. In the emerging ‘New Urban World’ (see Kourtit 2014, 2015), cities are not functioning as isolated islands, but have to compete in terms of their socio-economic and attractive achievements with other cities. Therefore, it is of utmost importance to identify the drivers of these achievements. In our study, we have presented the ‘urban piazza’ as a conceptual and coherent framework for mapping out the force field of modern cities, from the perspective of identifying and assessing the critical success factors for urban performance measured along two multidimensional criteria, viz. Economy and Livability.
Our study has used a comprehensive database for 40 cities all over the world to trace the drivers of urban performance, using the GPCI-database with qualitative rankings of all these cities. Our study has brought to light that there is not a ‘one size fits all’ result from our explanatory model. Different cities appear to have a varying performance through the influence of various important drivers. In many cases however, it turns out that accessibility and R&D may be seen as a major critical success condition, though in several cases in combination with other determinants of urban performance.
Urban performance analysis, as exemplified by our study, may become an important research tool in the future. Next to standard quantitative data, also qualitative information may prompt many insights into the success conditions of cities. Clearly, in the future, urban ‘big data’ may become another rich source of information, in order to better understand the fine-grained nature of urban dynamics and growth (Vaz 2016, Vaz, Arsanjani 2015, Vaz et al. 2014, 2015). It goes without saying that urban performance analysis may open new departures for research in the urban sciences. The rough set methodology applied here is a promising example of such a new analytical tool.
Clearly, RSA is able to act as an identifier in a complex pattern recognition exercise. Through a combinatorial algorithm, it offers a tool for conditional qualitative causal statements, in particular, by examining the frequency of validity of a statement on the presence of an explanatory variable impacting – either as a single variable or in combination with other variables — one or more endogenous variables. Clearly, there are three marked differences with a standard regression model: rough set analysis handles qualitative (even nominal) information; it is deterministic in nature; it can handle multiple response variables.
Clearly, the present study has some limitations. The sample of 40 cities is not very large in number, but this is largely compensated for by the in-depth systematic and accurately tested information provided on each individual city. Next, the benchmark picture of these 40 cities has a limited time horizon of at most 3 years, so that a really dynamic longitudinal perspective is lacking. Thus, there is certainly scope for analytical improvement in the future, so that in the end also more advanced urban econometric models might be developed and tested.
Acknowledgement
The authors wish to thank Eveline van Leeuwen for her great assistance in running the software for the rough set analysis.
References
Arribas-Bel D, Kourtit K, Nijkamp P (2013) Benchmarking of world cities through self-organizing maps. Cities 31: 248–257. CrossRef.
Baaijens S, Nijkamp P (1997) Time pioneers and travel behaviour: An investigation into the viability of slow motion. Tinbergen Institute Discussion Papers 97-132/3, Tinbergen Institute, Amsterdam
Batty M (2013) The New Science of the City. MIT Press, Cambridge
Deogun J, Raghavan V, Sarkar A, Sever H (1997) Data mining: Trends in research and development. In: Lin T, Cercone N (eds), Rough Sets and Data Mining – Analysis of Imprecise Data. Springer, New York, 4–46. CrossRef.
Doel M, Hubard P (2002) Taking world cities literally. City 6[3]: 351–368. CrossRef.
Famili A, Shen WM, Weber R, Simoudis E (1997) Data preprocessing and intelligent data analysis. Intelligent Data Analysis 1[1]: 33–47. CrossRef.
Fayyad U, Piatetsky-Shapiro G, Smyth P (1996) From data mining to knowledge discovery: An overview. Artificial Intelligence Magazine 17: 37–54
Greco S, Matarazzo B, Slowinski R (1997) Rough set approach to multi-attribute choice and ranking problems. In: Fandel G, Gal T (eds), Multiple Criteria Decision Making. Lecture Notes in Economics and Mathematical Systems, vol 448. Springer, Berlin, 318–329. CrossRef.
Gregory D, Johnston R, Pratt G, Watts M, Whatmore S (2009) Dictionary of Human Geography (fifth ed.). Blackwell, Oxford
Kourtit K (2014) The new urban world, assessment of creativity, diversity and attractivity of cities. PhD dissertation, VU University Press, Amsterdam
Kourtit K (2015) The new urban world: Economic-geographical studies on the performance of urban systems. PhD dissertation, Poznan, Poland
Kourtit K, Nijkamp P (2013a) Creative buzz districts in smart cities: Urban retro-fitting and urban forward-fitting plans. Romanian Journal of Regional Science 7[2]: 37–57
Kourtit K, Nijkamp P (2013b) In praise of megacities in a global world. Regional Science Policy and Practice 5[2]: 167–182. CrossRef.
Kourtit K, Nijkamp P (2013c) The new urban world – The challenge of cities in decline. Romanian Journal of Regional Science 7: 9–28
Kourtit K, Nijkamp P (2013d) The use of visual decision support tools in an interactive stakeholder analysis – Old ports as new magnets for creative urban development. Sustainability 5: 4379–4405. CrossRef.
Kourtit K, Nijkamp P, Franklin RS, Rodríguez-Pose A (2014) A blueprint for strategic urban research: The ’urban piazza’. Town Planning Review 85[1]: 97–126. CrossRef.
Kourtit K, Nijkamp P, Suzuki S (2013) Exceptional places: The rat race between world cities. Computers, Environment and Urban Systems 38: 67–77
Kourtit K, Nijkamp P, van Leeuwen E (2013) New entrepreneurship in urban diasporas in our modern world. Journal of Urban Management 2[1]: 25–47
Mills ES, Hamilton B (1994) Urban Economics (fourth ed.). Harper Collins, New York
Mori Memorial Foundation (2012) Global power city index 2012. Tokyo: Institute for Urban Strategies at the Mori Memorial Foundation
Neal ZP (2012) The Connected City – How Networks are Shaping the Modern Metropolis. Routledge, New York
Nijkamp P (2008) Xxq factors for sustainable urban development: A systems economics view. Romanian Journal of Regional Science 2[1]: 1–34
Orlowska E (2013) Incomplete Information: Rough Set Analysis. Physica Verlag, Heidelberg. CrossRef.
Pawlak Z (1991) Rough Sets: Theoretical Aspects of Reasoning About Data. Kluwer, Dordrecht
Pawlak Z (1992) Rough sets: Introduction. In: Slowinski R (ed), Intelligent Decision Support – Handbook of Applications and Advances of the Rough Set Theory. Kluwer, Dordrecht, 1–2
Pawlak Z, Grzymala-Busse J, Slowinski R, Ziarko W (1995) Rough sets. Communications of the ACM 38[11]: 89–95. CrossRef.
Pawlak Z, Skowron A (2007) Rudiments of rough sets. Information Sciences 177: 3–27. CrossRef.
Pawlak Z, Slowinski R (1996) Decision analysis using rough sets. International Journal of Approximate Reasoning 15[4]: 333– 365
Poel D (1998) Rough sets for database marketing. Physica-Verlag, Heidelberg, 324–335. CrossRef.
Polkowski L (2003) Rough Sets: Mathematical Foundations. Heidelberg. CrossRef.
Sassen S (1991) The Global City. Princeton University Press, Princeton. CrossRef.
Slowinski R (1995) Rough set processing of fuzzy information. In: Lin TY, Wildberger A (eds), Soft Computing: Rough Sets, Fuzzy Logic, Neural Networks, Uncertainty Management, Knowledge Discovery. Simulation Councils, San Diego, CA, 142–145
Slowinski R, Stefanowski J (1994) Handling various types of uncertainty in the rough set approach. In: Ziarko WP (ed), Rough Sets, Fuzzy Sets and Knowledge Discovery. Springer, London. CrossRef.
Taylor P (2004) World City Network. A Global Urban Analysis. Routledge, London
Tellier L (2007) The World Urban History. Presses Universitaires de Québec, Québec
Tranos E, Kourtit K, Nijkamp P (2014) Digital urban network connectivity: Global and Chinese Internet patterns. Papers in Regional Science 93: 409–428. CrossRef.
van den Bergh JCJM, Button K, Nijkamp P, Pepping G (1998) Meta-analysis in Environmental Economics. Kluwer, Dordrecht. CrossRef.
Vaz E (2016) The future of landscapes and habitats: The regional science contribution to the understanding of geographical space. Habitat International 51: 70–78
Vaz E, Arsanjani J (2015) Crowdsourced mapping of land use in urban dense environments: An assessment of toronto. The Canadian Geographer/Le Géographe Canadien 59[2]: 246–255
Vaz E, Cusimeno MD, Hernandez T (2015) Land use perception of self-reported health. Land Use Policy 46: 232–240
Vaz E, de Noronha Vaz T, Galindo PV, Nijkamp P (2014) Modelling innovation support systems for regional development–analysis of cluster structures in innovation in Portugal. Entrepreneurship & Regional Development 26[1-2]: 23–46
Wu C, Yue Y, Li M, Adjei O (2004) The rough set theory and applications. Engineering Computations 21[5]: 488–511. CrossRef.
Ziarco W (1998) Rough set as a methodology for data mining. In: Skowron A, Polkowski L (eds), Rough Sets in Knowledge Discovering. Physica Verlag, Heidelberg, 554–576
A Detailed Results
The frequency scores of the sub-sub factors in the six composite factors are recorded in Tables A.1 and A.2. When no number is shown, it means the variables are never part of a minimal reduct and therefore the least important ones in explaining the composite factors.
| Economy | % frequency |
| GDP per Capita | 100 |
| World’s Top 300 Companies | 100 |
| Office Area per Employee | 100 |
| Level of Economic Freedom | 50 |
| Number of Employees | 50 |
| Corporate Tax Rate | 50 |
| Nominal GDP | 25 |
| GDP Growth Rate | 25 |
| Total Market Value of Listed Shares on Stock Exchanges | |
| Number of Employees in Service Industry for Business Enterprises | |
| Wage Level | |
| Ease of Securing Human Resources | |
| Level of Political, Economic and Business Risk | |
| Livability | % frequency |
| Maturity of Community | 100 |
| Average House Rent | 83 |
| Medical Doctors per Population | 83 |
| Price Level | 50 |
| Healthy Life Expectancy Rate | 50 |
| Total Unemployment Rate | 33 |
| Population Density | 33 |
| Total Working Hours | 17 |
| Satisfaction of Employees for their Lives | 17 |
| International Schools per Foreign Population | 17 |
| Number of Murders per Population | |
| Variety of Retail Shops | |
| Variety of Restaurants | |
| Research and Development | % frequency
| |
| 4 classes | 3 classes | |
| Number of Winners of Highly-Reputed Prizes | 100 | 25 |
| Interaction Opportunities Between Researchers | 100 | 25 |
| Number of Researchers | 67 | 100 |
| World’s Top 200 Universities | 67 | 100 |
| Academic Performance in Mathematics and Science | 67 | 25 |
| Research and Development Expenditure | 50 | 25 |
| Number of Registered Industrial Property Rights (Patents) | 33 | |
| Readiness for Accepting Foreign Researchers | 17 | 100 |
| Cultural Interaction | % frequency
| |
| 4 classes | 3 classes | |
| Number of Theaters and Concert Halls | 100 | 29 |
| Number of Visitors from Abroad | 100 | 57 |
| Opportunities of Cultural, Historical and Traditional Interaction | 100 | |
| Number of Stadiums | 50 | 14 |
| Number of Large World-Class Cultural Events Held | 50 | 57 |
| Trade Value of Audiovisual and Related Services | 50 | |
| Number of International Conferences Held | 25 | 43 |
| Environment of Creative Activities | 25 | 14 |
| Number of Museums | 100 | |
| Number of Guest Rooms of Luxury Hotels | 100 | |
| Number of Hotels | ||
| Level of Satisfaction for Shopping | 86 | |
| Level of Satisfaction for Dining | 100 | |
| Number of Foreign Residents | ||
| Number of International Students | 100 | |
| Number of World Heritage Sites (within 100km Area) | ||
| Environment | % frequency
| |
| 4 classes | 3 classes | |
| CO2 Emissions | 100 | 100 |
| Density of Suspended Particulate Matter (SPM) | 100 | 100 |
| Level of Green Coverage | 100 | 100 |
| Comfort Level of Temperature | 100 | 100 |
| Number of Companies with ISO 14001 Certification | 50 | 100 |
| Density of Sulfur Dioxide (SO2), Density of Nitrogen Dioxide | 50 | 100 |
| (NO2) | ||
| Percentage of Renewable Energy Used | 100 | |
| Percentage of Paper Recycled | ||
| Water Quality | ||
| Accessibility | % frequency
| |
| 4 classes | 3 classes | |
| Punctuality of Public Transportation | 100 | |
| Density of Metro Stations | 86 | 100 |
| Cities with Direct International Freighter Flights | 85 | |
| Number of Cities with Direct International Flights | 71 | |
| Number of Runways | 43 | |
| Travel Time between Inner-city Areas and International Airports | 43 | 100 |
| Number of Passengers on International Flights | 29 | 100 |
| Convenience of Commuting | 29 | |
| Transportation Fatalities per Population | 100 | |
| Taxi Fare | ||