 Volume
4, Number 1, 2017, 17–30 journal homepage:
region.ersa.org
Volume
4, Number 1, 2017, 17–30 journal homepage:
region.ersa.orgDOI: 10.18335/region.v4i1.102
Analysis of Freight Trip Generation Model for Food and Beverage in Belo Horizonte (Brazil)*
1 Universidade Federal de Minas Gerais, Belo Horizonte, Brazil (email: leise@etg.ufmg.br)2 Universidade Federal de Minas Gerais, Belo Horizonte, Brazil (email: raanobrega@ufmg.br)
3 Centro Universitàrio Formiguense, Formiga, Brazil (email: daniel_ebias@outlook.com)
4 Universidade Federal de Minas Gerais, Belo Horizonte, Brazil (email: bgesc@hotmail.com) Received: 20 November 2015/Accepted: 22 December 2016
*The support of the National Council for Scientific and Technological Development (CNPq) is acknowledged and appreciated. The authors thank the Municipality of Belo Horizonte for the database, which allowed the analysis of this study. The authors would also like to thank anonymous reviewers for the suggestions to improve this paper.
Abstract. Today, one of the main challenges faced in urban logistics is the distribution of goods. In Brazil, mid to large cities have experienced negative consequences of unplanned urban sprawl as well as the lack of adequate transport infrastructure. As for the logistic standpoint, the relationship between urban planning and transportation planning must be better exploited towards the promotion of quality of life, and economic and environmental sustainability. The attractiveness of urban activities that attract the movement of people and goods and other component elements of urban space should be investigated. The presence of bars and restaurants falls within this context and is therefore vital and responsible for a significant percentage of jobs and revenue in a city. This paper presents the results of a freight trip generation model developed for pubs and restaurants in Belo Horizonte (Brazil). The data for the freight trip generation model were obtained by survey. A structured questionnaire was designed to obtain information about goods, frequency, operational time, place of performance of the loading/unloading of goods, establishment size and the number of employees. In creating the proposed models, a simple linear regression was applied to correlate the following variables: (i) number of trips versus area of the establishment; (ii) number of trips versus number of employees; (iii) number of trips versus operation day of the establishment. With the results of the linear regression for trip generations, data interpolation was conducted based on the standard deviation of the results to define the sample classification bands. Finally, the resulting trip generation surface was analysed together with other geographic data such as demographic data, road network density and socioeconomic data. Findings indicate the importance of a mathematic-geographic model for trip generation as a feasible approach to support transportation planning & operation for urban goods distribution. Critical information such as the high concentration of pubs and restaurants in the same region can reinforce the vocation of the city for trading. However, an elevated number of freight vehicles to meet a high and growing demand becomes a problem especially in areas where the urban road network is not efficient (not properly designed and parking spaces not properly used). This study also highlights the need for an urban freight mobility plan and public policies, by offering sustainable alternatives for urban goods distribution, which improve the urban environment. By using geospatial analysis, the study delivered statistics data and maps to catch the attention of decision makers and transportation managers, therefore facilitating the discussion on transportation policies in the city of Belo Horizonte.
Key words: urban goods distribution, freight trip generation, trucking, pubs and restaurants, geospatial analysis, Brazil
1 Introduction
Nowadays, the distribution of urban goods is one of the main challenges faced by policy makers, transportation authorities and the private sector in Brazilian cities. These cities present mostly a pattern of non-organized growth, lack of planning, and especially a lack of adequate infrastructure. Other than these well known factors there is also an increasing rate of population density. According to the Brazilian Institute of Geography and Statistics (IBGE 2010), about 83.4% of Brazil’s population lives in urban areas. Concomitantly to the lack of planning for the use of urban space, the increasing volume of vehicles is also aggravating the situation. The population growth in the city increases the demand for goods and services that potentiate the problems related to urban mobility and urban freight transport. According to Holguín-Veras et al. (2012), the relationship among land use and freight represents a central issue for adequately planning investments in infrastructure and land use policy. However, the current transportation planning process in Brazil does not estimate freight activity to assist decision makers, which is critical information to be considered when making infrastructure investment choices. This fact motivated the development of this study, which presents data and models to estimate the flow of urban freight vehicles.
In this context, we hypothesize in this investigation that a transportation model sensitive to geographic-based context will add quality and efficiency to computing freight trip generation by considering local characteristics. Thus, this paper’s analysis of a freight trip generation model was computed based on a survey developed for pubs and restaurants in the city of Belo Horizonte, Brazil. We analyse pubs and restaurants due to this sector’s importance in Belo Horizonte (area of study); it represents 42% of the number of deliveries in the central Area (Oliveira 2014, Oliveira, Guerra 2014). Besides that, what makes this study distinct is its characterization of the sector and the geographical analysis of the results, which intends to inform transport policies for the distribution of food and beverage in pubs and restaurants. The methodology proposed in this study intends to provide a guideline for planning of urban freight transport in order to obtain data for freight transport policies through field surveys (this type of analysis is still incipient in the Brazilian context).
The paper is structured as follows: Section 2 provides a brief literature review on urban freight trip generation models in the Brazilian context; Section 3 describes the study area; Section 4 describes the methodology and data; results are illustrated in Section 5; and Section 6 concludes and discusses future research.
2 Brief notes about urban freight trip generation models
The estimation of freight trip generation is a critical component of traffic impact analyses (Holguín-Veras et al. 2013) and very important information to understand how goods move within an urban area. To Kulpa (2014, p. 197), freight trip generation refers to different areas or particular objects and may be estimated either by the number of vehicles (truck based model) or by the quantity of commodities measured in tons or values (commodity based model). Comi et al. (2012) also consider the delivery approach, which focuses on movements of goods measured in pick-ups and deliveries (delivery based model).
Brogan (1979) used trip rate per unit of area to understand the relationship between the number of truck-trips produced in/or attracted to an area, as well as the characteristics of that area. The author stated that the use of these rates contributes to the analysis of the impact of major truck-generating activities in certain sections of an urban area. An examination of the developed truck trip rates shows that, in general, commercial and industrial land uses are the largest generators of truck trips.
For Ogden (1992), understanding the relationship between transport and demand patterns is an essential component for modeling freight movement in urban areas. It evidences the link between movements of people and goods. Ogden (1992) also establishes a distinction between models based on movement of goods and models based on truck trips. In the model based on the movement of goods, producers and customers in a specific region create the demand for the movement of goods. Thus the movement of vehicles is a response to meet this demand. As a consequence, the truck trips establish a direct relationship with the movement of goods, and consequently the model outputs a certain amount of vehicle travel allocation. The author also developed models of attraction of products based on goods as well as on trips.
Tadi, Balbach (1994) estimated truck trips generated at warehouses, industrial sites, truck terminals and building areas using a regression model. Iding et al. (2002) developed a linear regression model that considers site area and number of employees as an alternative to the size of a business for each trip production and trip attraction per sector of industry.
Allen Jr. (2002) developed a demand forecast model to estimate the number of trips for medium and heavy trucks, considering the number of businesses and residences. Iding et al. (2002) present a freight trip model, obtaining attraction/production equations for different sectors, considering the area and the number of employees. Black (1999) developed similar study for Indiana-USA, considering 20 different products.
Comi et al. (2012) review the state-of-the-art on urban freight transport demand modelling and present different approaches after considering their pros and cons. One of the main conclusions of the authors is that the “direction relation between policies/measures and stakeholder’s behaviours has not been investigated enough in the urban freight transport modelling literature” (Comi et al. 2012, p. 12). Anand et al. (2012) make a contribution to this gap, reviewing the literature concerned with urban freight modelling from the stakeholder’s point of view describing their objective, descriptor choice and perspective towards the stakeholders’ objective. Gonzalez-Feliu, Routhier (2012) analyze different models considering the function of the model, its scope and initial objectives, unit, model building approaches, choice of granularity and commercial applications and tools. An important conclusion of this review is about the relationship between goods flows and vehicle flows: if the focus is the impact of urban freight transport on urban traffic, the model unit must be considered vehicle-flows rather than commodity-flows which is commonly used in freight trip models. However converting commodity-flows to vehicle-flows is not a simple task (Gonzalez-Feliu, Routhier 2012). The authors claim that “modeling is not possible without knowledge of the existing situation, and in particular, knowledge about what is subject to change and what is invariable”, so they suggest the development of procedures capable to understand the variation of data in space and time (Gonzalez-Feliu, Routhier 2012, p. 98).
Cherrett et al. (2012) indicate that 1.77 deliveries/week/100m2 are transported in Winchester (UK). Using secondary data, Ducret, Gonzalez-Feliu (2016) attempt to connect a demand-estimation model and spatial modeling to evaluate the link between urban form characteristics and freight movements. The authors found that 2.9 deliveries/day are made by light commercial vehicles and 0.4 deliveries/day are made by single trucks, in Angers (France).
Holguín-Veras et al. (2016) discuss freight trip generation estimates. The authors indicate that “freight behavior research could be either a qualitative or a quantitative nature” (Holguín-Veras et al. 2016, p. 45). Priya et al. (2015) investigate an improved truck-trip model using time series, artificial neural networks and patterns of land-use.
With an innovative approach to model urban freight, Aditjandra et al. (2016) use a traffic survey and micro-simulation modeling to identify the impacts of freight deliveries and local service traffic at peak periods nearby the university campus in Newcastle (UK). The authors demonstrate that traffic surveys can be useful to assess the impacts of urban built environments on urban freight traffic. Sànchez-Díaz et al. (2016) propose a new set of variables that relate the establishment to its location, and assesses the performance of novel explanatory variables on freight trip models. The results show that freight trip attraction is better modeled as a nonlinear function of employment and other geographic-based variables.
2.1 Urban freight models in the Brazilian context
Investigations of freight trip generation in the Brazilian context are incipient. There have so far been a few studies focused in São Paulo (Silva, Waisman 2007), Rio de Janeiro (Melo 2002, Gasparini 2008, Souza et al. 2010) and Campinas (Marra 1999). Marra (1999) developed a freight trip generation model designed for residential and commercial areas, based on the monthly freight flow. The model considers the area, the number of employees or residents and the average income per capita in the area as dependent variables. Melo (2002) developed an urban freight trip model for the city of Rio de Janeiro that considers groceries, clothing, retail stores, pubs and restaurants, construction material and fuel.
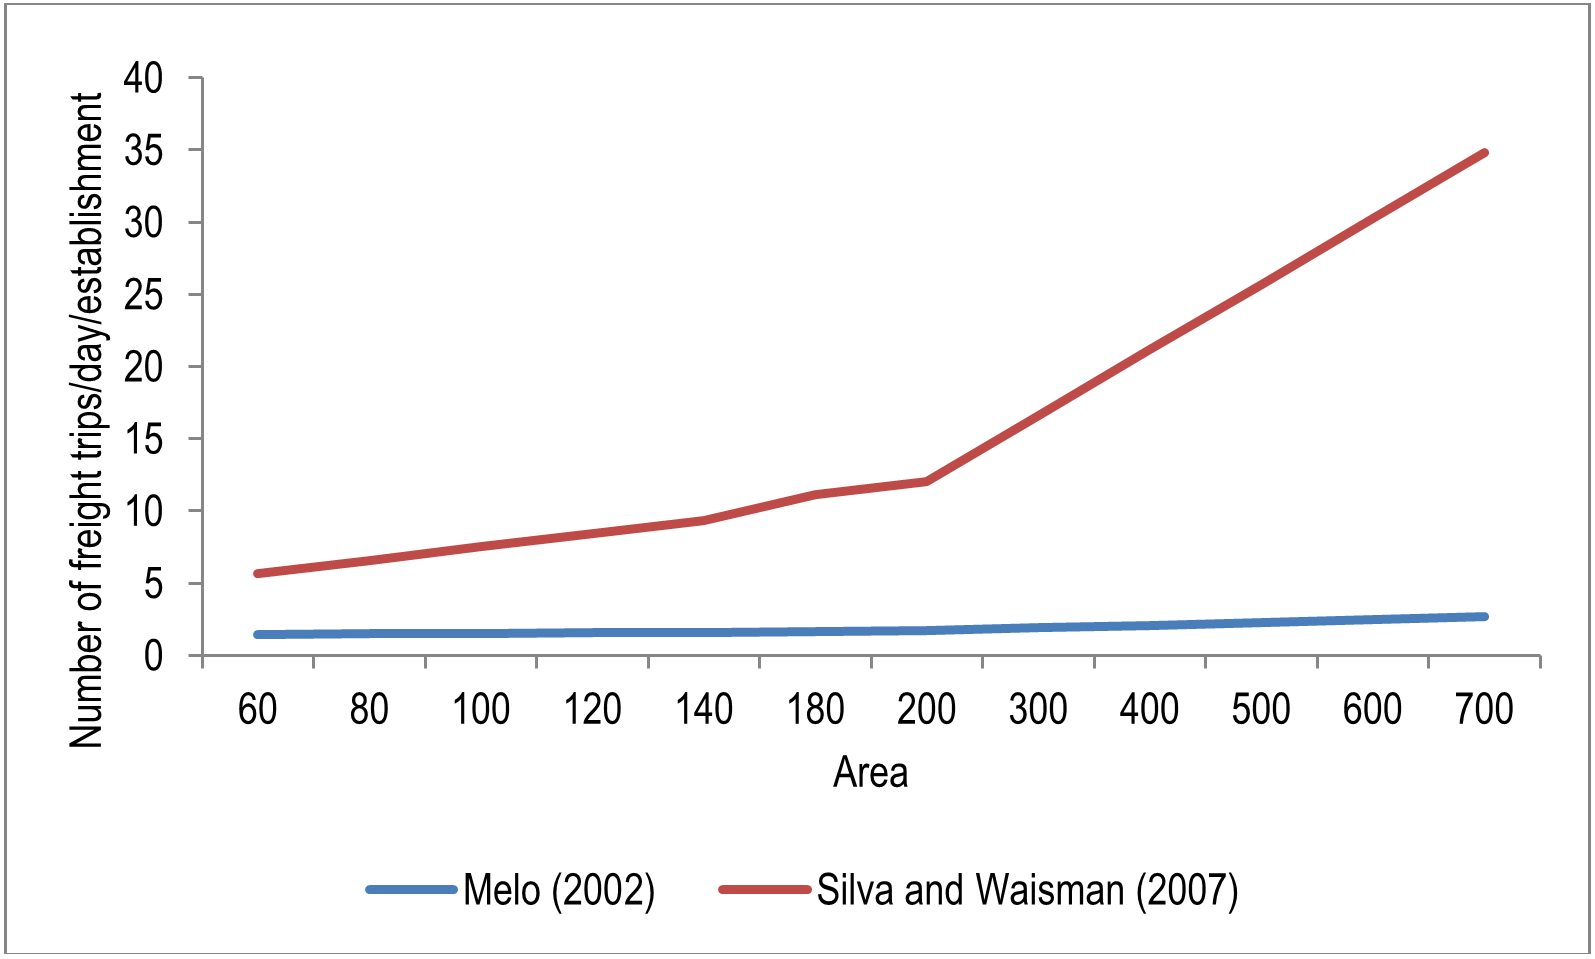
In particular, the sector of foods and beverages (focus of this paper) is a critical segment responsible for jobs, revenue and social activities vital to maintaining the economic sustainability of a city. Pubs and restaurants constitute a substantial volume of trips by attracting the movement of people and goods. Melo (2002) found 1.94 trips per day for establishments with an area between 60 and 780 square meters. Silva, Waisman (2007) developed a study that determined the freight trip generation rate for pubs and restaurants to a specific district in the city of Sao Paulo. The authors conducted a survey through a questionnaire for thirty establishments and collected information on daily freight trip rates, area of the establishment (in square meters) and number of employees. The authors identify the correlation between variables using multiple linear regressions. Gasparini (2008) developed a survey that analysed the freight trip rates for supermarkets and shopping malls in the city of Rio de Janeiro using the area, the number of customers, the number of parking spaces and the sales area as dependent variables in the model. The equations used in Brazilian freight trip studies to pubs and restaurants are presented in Table 1.
|
Reference |
Equation |
Trips
per
establishment |
Dependent
variable |
R2 |
|
Melo (2002) | T = 1.333 + 0.0019A | 1.94 | Area | 0.797 |
|
Silva
and
Waisman
(2007) | T = 2.963 + 0.0455A |
- | Area | 0.705 |
| T = 1.972 + 1.459E | Employers | 0.739 | ||
| T = 2.074 + 0.017A + |
Area
and
Employers |
0.754 |
||
| 0.967E | ||||
The approaches undertaken from the Brazilian context rely on the use of linear or polynomial regression and logarithm or exponential fit to determine the freight trip rates. Findings demonstrated a good fit (R2 ≥ 0.7), with wide divergences however, for the same variable as showed in Figure 1. Even with these good results, Souza et al. (2010) indicate the need for different equations or rates for different classes of goods and vehicles. This discussion demonstrates the complexity of the problem to be modelled and the importance of this topic of research.
The use of linear or polynomial regression as a methodology is a current trend, with Shin, Kawamura (2005), Bastida, Holguín-Veras (2009), Holguín-Veras et al. (2012), Holguín-Veras et al. (2013) and Priya et al. (2015) all using regression analysis to obtain a freight trip model. Sànchez-Díaz et al. (2016) incorporate locational variables and Aditjandra et al. (2016) use a traffic survey. The concept of locational variables is employed in the present study, which considers the importance of geographic-based information to evaluate which Brazilian model is more appropriate to estimate freight vehicle flows.
3 Study area and object of the investigation
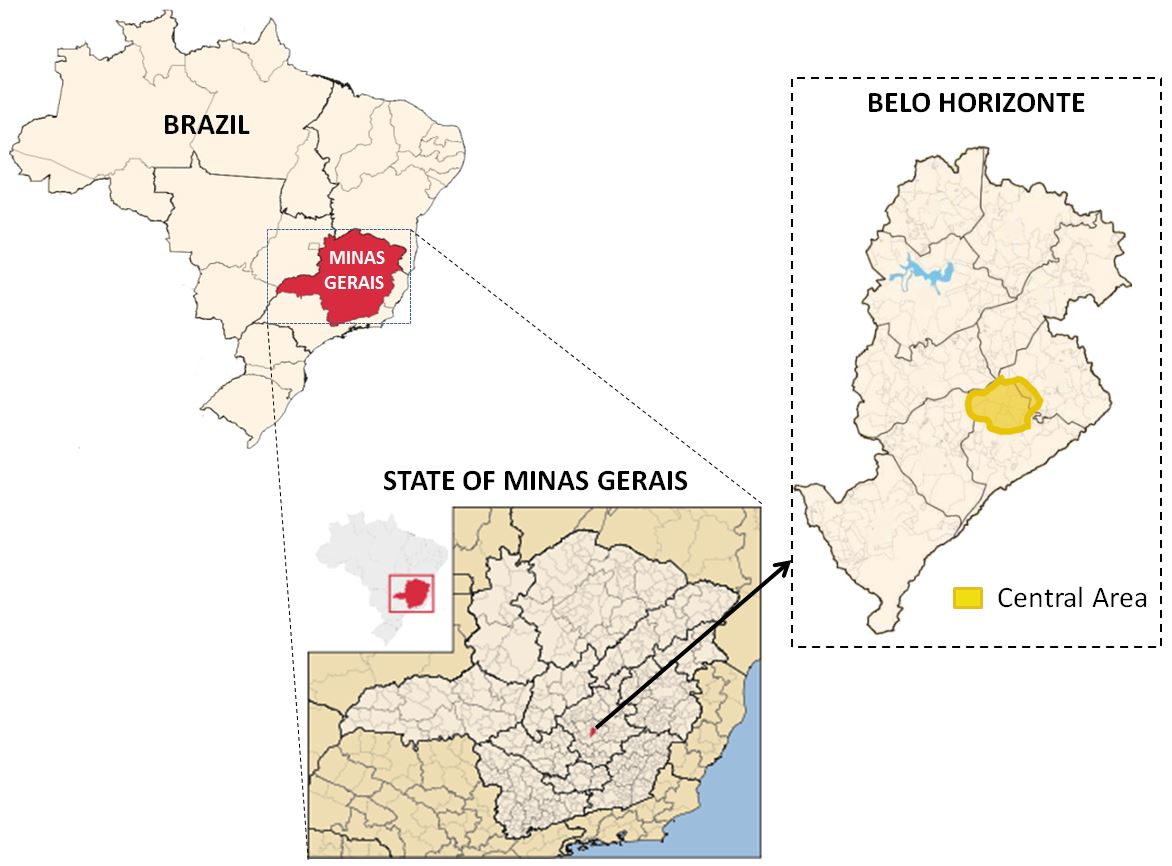
This study focuses on the pubs and restaurants sector in Belo Horizonte city, which represents 42% of the number of deliveries in an area that contains the large majority of commercial establishments and urban mobility problems as well (Oliveira 2014, Oliveira, Guerra 2014). Belo Horizonte, founded in 1897 was planned to be the capital of the state of Minas Gerais. The plan envisioned a modern city that in 2010 could have a maximum population of 200,000 inhabitants living and working within the central boundary limited by Contorno Avenue (Oliveira et al. 2016).
Belo Horizonte has about 2.4 million inhabitants heterogeneously distributed over an area of 331 km2. The city currently has the fourth largest Gross Domestic Product (GDP) of those in Brazil, with about 58.3 billion real (approximately currency rate: 1 euro is 3.60 real in October/2016). As a capital, commerce and public services are the key economic activities that propel the trading vocation of the city. The revenue comes mostly from services and commercial businesses, whereas the downtown area concentrates the federal, state and municipal governmental offices as well as an elevated number of commercial offices and industry headquarters. Belo Horizonte is surrounded by industrial-based cities and small towns mostly used as dormitory cities. The infrastructure of the capital’s downtown makes it the most attractive area to retain hotels, restaurants, cafés and entertainment. This segment employs a substantial amount of jobs and makes an important contribution to the city’s revenue.
In this investigation we hypothesize that a transportation model sensitive for geographic-based context will add quality and efficiency to computing freight trip generation by considering local characteristics. Thus, this paper analyses a freight trip generation model computed based on a survey developed for pubs and restaurants in the city of Belo Horizonte, Brazil. The distinctiveness of this study is the characterization of the sector and the geographical analysis of the results, which intends to inform transport policies for the distribution of food and beverage in pubs and restaurants. The methodology proposed in this study intends to provide a guideline for the planning of urban freight transport in order to obtain data for freight transport policies through field surveys (this type of analysis is still incipient in the Brazilian context).
4 Methodological approach
In theory, the data collection on movement of goods in an urban area can be obtained in different ways. In practice, however, because of the lack of waybill records or because of the nonexistence of registered information about trips, data about how, where the trips took place and about the volume of goods that flow in a city has been better obtained via survey. In this study we obtained data from specific stakeholders (retailers), based on interviews, as developed by Aditjandra et al. (2016). For the purposes of modeling urban goods, our data is categorized as vehicle/journeys (the route), as presented in Gonzalez-Feliu, Routhier (2012), and our model structure is defined as truck/vehicle as presented in Comi et al. (2012). These definitions are very important to characterize our methodology, which consists of:
- 1.
- develop a questionnaire to obtain freight flow data;
- 2.
- collect the data;
- 3.
- build and calibrate the model;
- 4.
- geographically analyse the results to understand the sector’s impact on urban traffic.
4.1 Questionnaire
We developed a standard survey designed to obtain data that enables modeling of the vehicle journey categorized by foods and beverages. Table 2 presents the main information in the questionnaire. The questionnaire was validated with a pilot test in 10 commercial establishments and provides a database on the goods received in the establishments.
| Type of information | Detailed information |
|
Information of establishment | Location |
| Name and function of interview | |
| Telephone and mail | |
|
Characteristics of establishment | Foundation time |
| Day and working time | |
| Area (square meter) | |
| Number of employment | |
|
Receipt of goods | Origin of goods |
| Number of trucks by day of week | |
| Time of delivery | |
| Unload time | |
4.2 Data collection
The data collection was performed via interview. The interviews were conducted with the manager of the establishment or a technical staff member responsible for logistics operations. Unfortunately not all planned interviews were possible due to a lack of technical information, non-authorized personnel or when the establishment showed no interest in cooperating with the investigation.
The survey was conducted in 300 establishments. After the collection of data, the sample size was analyzed to determine the error and, for that, we used the simple random sample method. Other than information about the location of the pubs and restaurants, the interviewer also asked about desired and used routes, the time of the delivery and information about unload parking. Results are presented in Section 5.
4.3 Building and Calibrating the Model
The creation of the freight trip model presented in this paper was supported by a methodology developed by the Institute of Transportation Engineering (ITE 2008). Building a model requires a systematic comprehension of how data, tools methods and deliverables must be organized. Thus, the development of the model adds a methodological dimension for the approach, the data collection, the explanatory variables, the sampling elements and the date of the survey, that can be replicated in future investigations.
Besides the large number of variables and the complexity of the model for the development of the survey, it was also necessary to (ITE 2008):
- Consider the nature of the proposed model (type and size, geographical location, time/day that the model will be calibrated);
- Choose establishments that have characteristics that enables their travel demand to be
modelled, such as:
- it must be possible to reach an average rate of generation of trips with at least three elements;
- it must be possible to use linear regression equations with six elements, but it is desirable to have at least 20 elements in the sample;
- Check the statistical correlation of the obtained model.
To define the model, we use linear regression. To validate the equations we use the coefficient of determination (R2), which demonstrates how well an adjustment curve represents the relationship between the dependent and independent variables; the Student’s t-test that determines the level of significance between the variables and the size of the sample; and the F-test that determines if the model is useful in predicting the flow. For this study, we considered valid the equations for which R2 is greater than 0.5 (ITE 2008), ie, which represent 50% of the sample. In addition, we consider a confidence level of 95% for the t-test and significance level of 5% for the F-test. It is important to mention that models are best fit when R2 is greater than 0.5, the sample size is greater than or equal to 4, and number of trips increases as the size of the independent variable increases (ITE 2008).
4.4 Geographical analysis
Once the trip generation model was computed, the establishments were located on the map by geocoding the addresses. We used Geographic Information System (GIS) tools to compute a continuous surface by interpolating the discrete values of travel per day delivered from the trip generation model. The method interpolates a raster surface from points using an inverse distance weighted (IDW) technique, which determines cell values using a linearly weighted combination of a set of sample points (travel per day per establishment). The weight is a function of inverse distance. The surface interpolated represents the dependent variable.
The interpolated surface represents the expected number of trips expanded to areas where sampling was not performed. Along with other maps, such as socioeconomics and transportation infrastructure, the spatial analysis helps to identify and understand the shortcoming and promotes a comprehensive standpoint for approaching the solution. For example, the solution can be applied to compute trip generation identifying areas with major demands of goods, therefore geographically correlating these areas with patterns of population income, age or behavior. This allows evaluation of the efficiency of the transportation policies that regulate urban distribution. As reported in Ducret, Gonzalez-Feliu (2016), which considered spatial categorization, urban freight modeling coupled to a GIS was used to demonstrate that spatial modeling can help organize logistics in the cities. In this work we aim to show the importance of integrating a robust freight trip generation model and GIS solution for providing an improved overview towards effective public policies for the city. Solutions in urban transportation planning must be addressed differently according to different aspects of population density and demand for goods.
5 Results and discussion
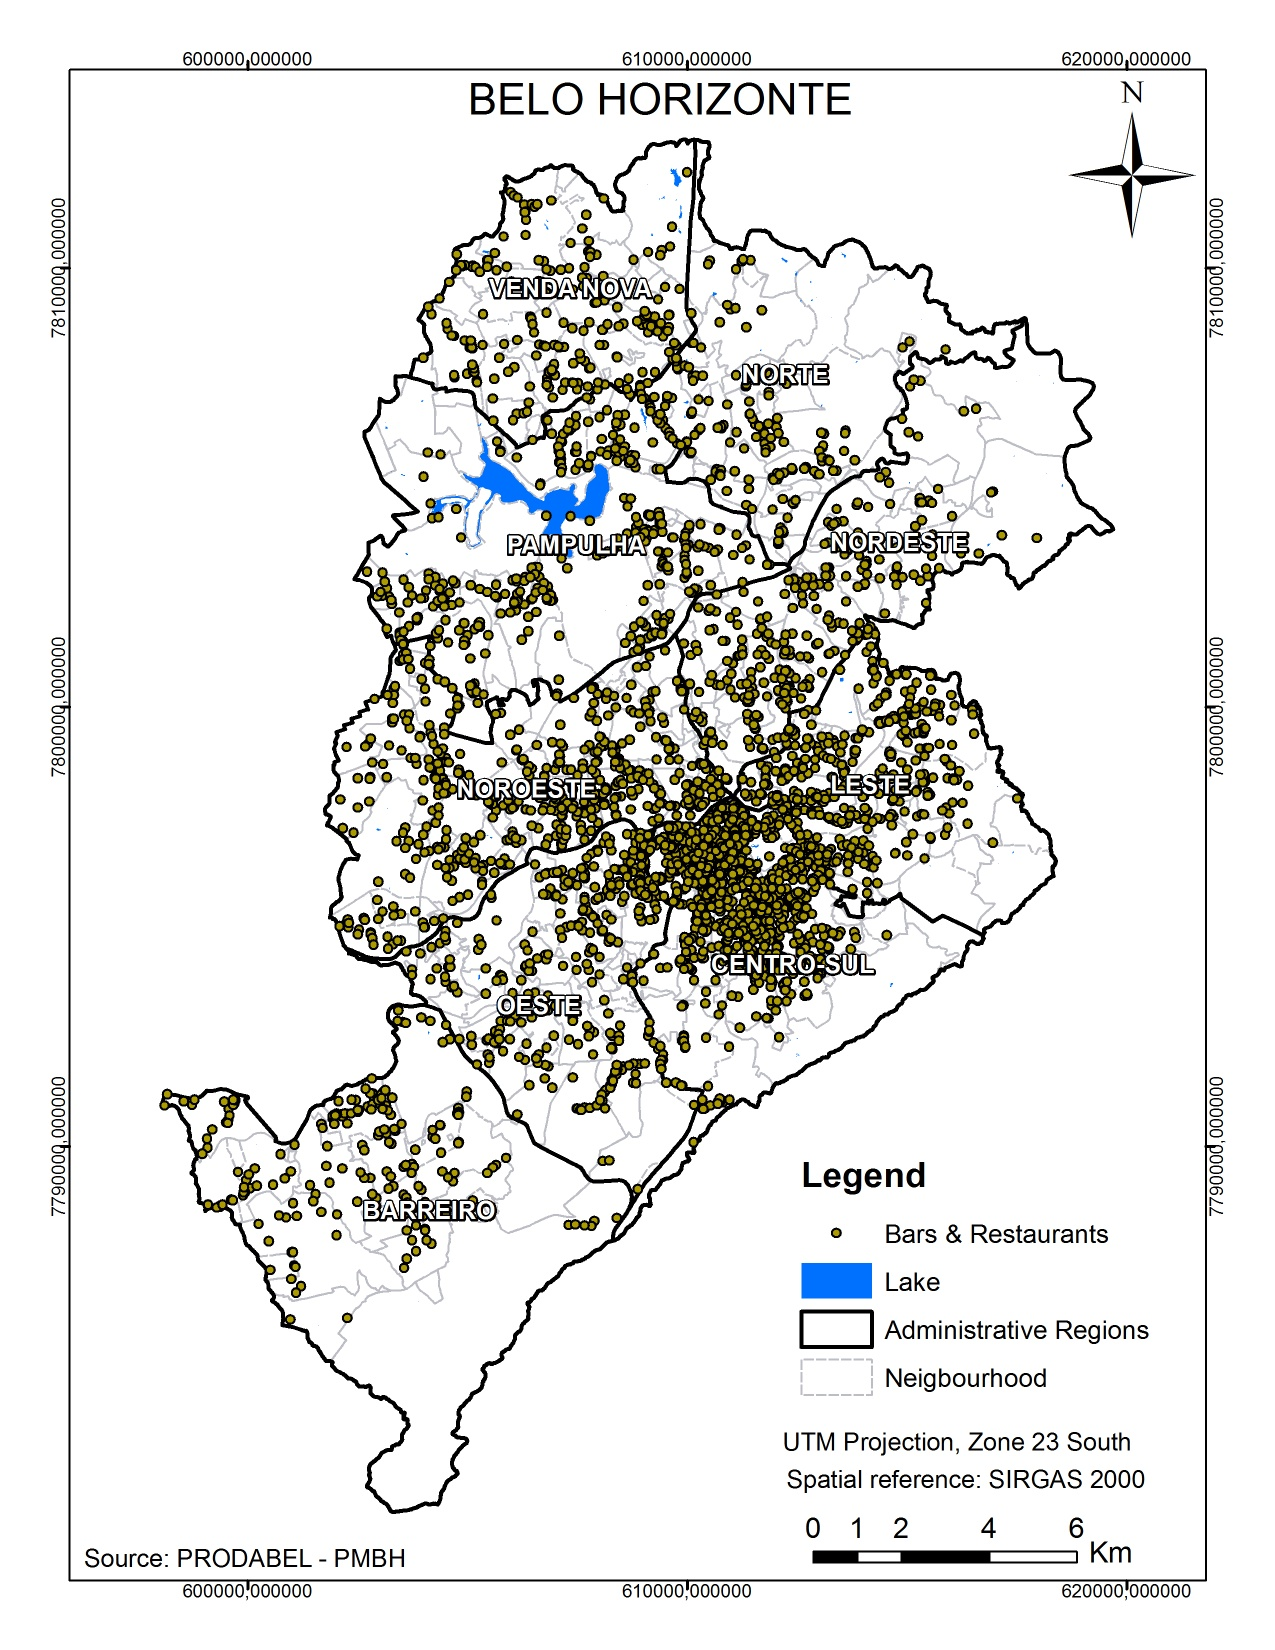
We used the Municipal Register of Taxpayers (MRT) provided by the Municipality of Belo Horizonte to know the total of establishments in the city. We identified 2,145 establishments as pubs, restaurants, juice houses or similar economic activity in this sector with the MRT database. We don’t divide our sample and analyses in subcategories due to all establishments having similar characteristics: all commercialize food and drinks. Figure 3 shows the geographical dispersion of the selected establishments with high concentration in the ‘Centro Sul’ Region (59%). The ‘Centro Sul’ Region encapsulates the downtown area, and contains a large amount of jobs and a high density of residents, which compete daily for street use, parking spaces and mobility, therefore aggravating the problems of loading/unloading goods.
From the period July to August, 2014 we visited and interviewed three hundred establishments in the Belo Horizonte region. The sample has an error of 5.4% compared to the total amount of establishments, considering the simple random sample method. Our sample contains establishments with a building area of between forty-five and four hundred square meters, and with between one and thirty employees.
Our findings show that goods are delivered between five and six times a week in 66% of the establishments, except meat, fish and fresh food that have daily deliveries. The deliveries occur between 08:00 am and 10 am (71%). Beverages are delivered three to four times a week in 49% of the establishments, without a specific standard time for this kind of delivery. The peak day for deliveries is Tuesday (30%) followed by Friday (23%).
5.1 Freight trip generation model
After obtaining the data we applied the linear regression technique to correlate the dependent with the other independent variables. In this study, we considered as the dependent variable the number of freight trips and as the independent variable the area of the establishment and number of employees. We used the Pearson product-moment correlation coefficient to analyze the correlation between variables: when analyzing the number of freight trips and number of employees, , = 0.74 indicates a strong correlation between these variables. When considering number of freight trips and area of establishment; n = 0.70 also indicates a strong correlation between the variables. Using regression analysis to correlate the variables, we obtain results presented in Table 3. These models represent the number of daily freight trips (NT) attracted by establishments, considering area (A) and number of employees (E). It is necessary to multiply by a factor of 0.71 to determine the number of trips in peak hour (8am-10am).
| Model | Equation | R2 | T-Stat. | F-Test |
| Area (m2) | NT = 0,98 + 0,0016A | 0.48 | 1.97 | 283 |
| NT = 0,0076A | 0.81 | 1.97 | 1,339 | |
| Employee | NT = 1,04 + 0,019E | 0.55 | 1.97 | 363 |
| NT = 0,01E | 0.67 | 1.97 | 605 | |
| Area (m2) and | NT = 1.01 + 0.014E + 0.00049A | 0.55 | 1.97 | 189 |
| Employee | ||||
The models obtained are valid for establishments with:
- Area between 40 and 400 m2;
- Number of employees between 1 and 30.
The statistical significance of the results was tested: the squared correlation (R2) indicates that a minimum of 48% of the variability in the “number of freight trips” is explained by the “area”. The best model correlates the “number of freight trips” and “area”.
Figure 4 shows the comparison of the results of this study with other Brazilian models. The comparison indicates that the Silva and Waisman model estimates a large number of freight trips and has lower accuracy. The results found in this study are similar to the model presented by Melo. To check the accuracy of the model, we compare the real data with the model outputs. Considering the model that correlates area and the numbers of employees (model 3), the results are 0.4% overestimated than the real values.
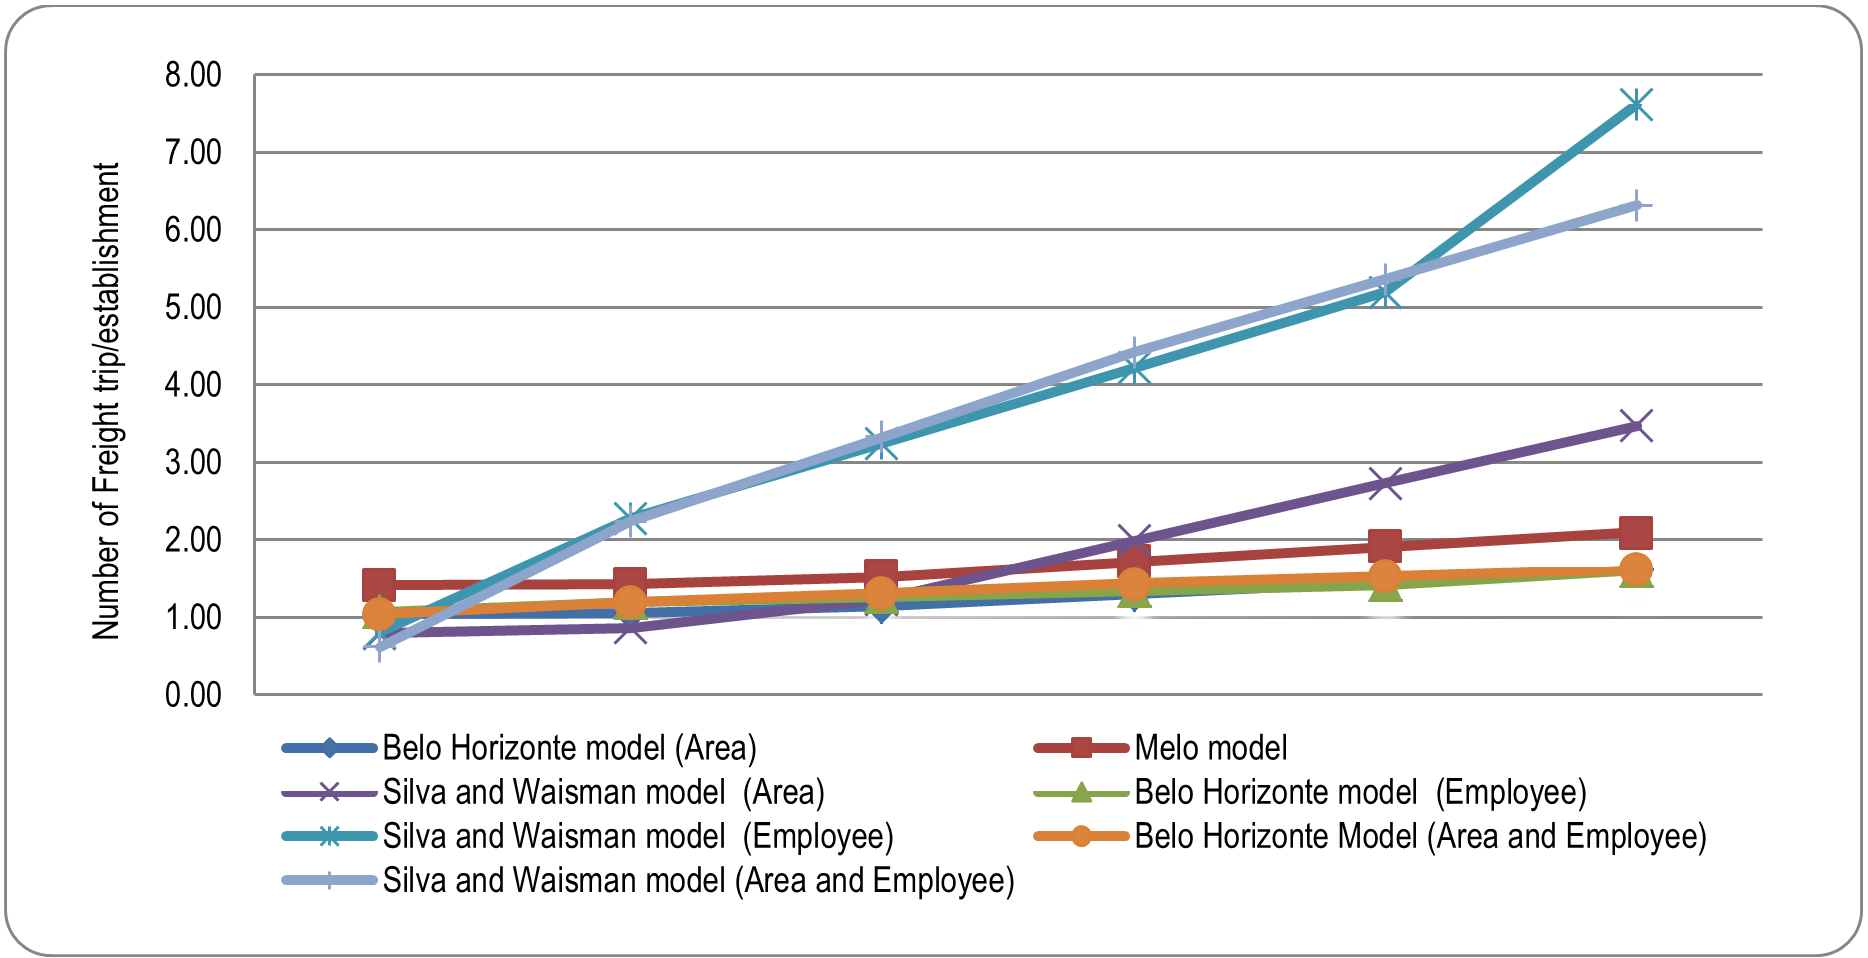
Figure 5 shows the concentration of deliveries in Belo Horizonte, considering freight traffic to deliver goods in pubs and restaurants between 8am-10am. These findings, when combined with the situation of the urban transportation infrastructure and the current transportation policies, reveals an alarming scenario. According to the numbers, in this scenario 71% of the pubs and restaurants require their goods deliveries in a very short time. Thus, it is easy to picture that this scenario creates a large amount of vehicles competing for parking spaces and reducing flow efficiency of the streets.
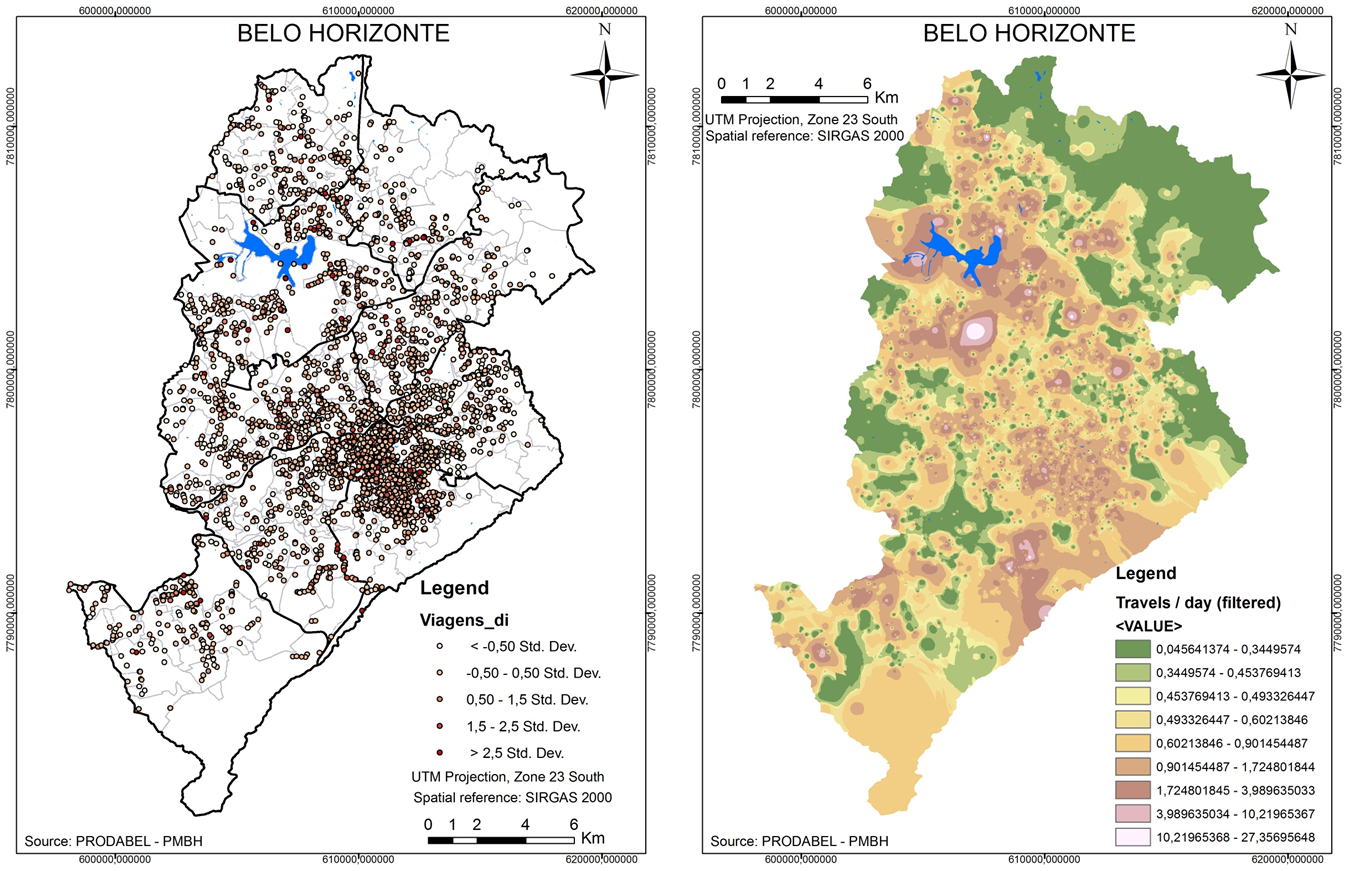
These results indicate the need for efficient public policies for urban freight transport. The pubs and restaurant sector is the only sector of the economy that generates a significant number of trips that overloads the transport infrastructure in these saturation times. Thus, the geographical analysis of results reinforces the results of the mathematical model and allows us to understand the extent of the problem.
5.2 Geographic overview of the model
The model provides an outstanding source for understanding the expected number of travels per business establishment. Based on this kind of information, urban planners and transportation managers can see and interact with indexes that reflect the demand for trip per business unit. However, the phenomena involved in the freight generation model includes a spatial component, which can be well explored if the geographic perspective is considered.
Transportation and economic development are areas intrinsically correlated in time and space. Therefore they rarely can be dissociated, especially when the goal of the study is to support public policies. For this reason, we introduced a basic structure, however realistic, for geographic analysis using the resulting model.
The model outputs the expected number of trips per day per establishment. The Municipal Register of Taxpayers data provides the addresses for the establishments. Together, these data were combined and displayed in a map. The surface provides the expected amount of trips per day for other regions in Belo Horizonte. It could be used, for example, to estimate trips per establishment for establishments that were not listed in the database or to provide an overview of the complex and delicate scenario of freight demand.
The geographic overview allows transportation and public managers to think about the freight in conjunction with other key factors that attract or repulse good deliveries in different regions of the city. Figure 6 illustrates a case scenario of downtown Belo Horizonte, which contains the majority of pubs and restaurants, a large amount of residents and a complex transportation network.
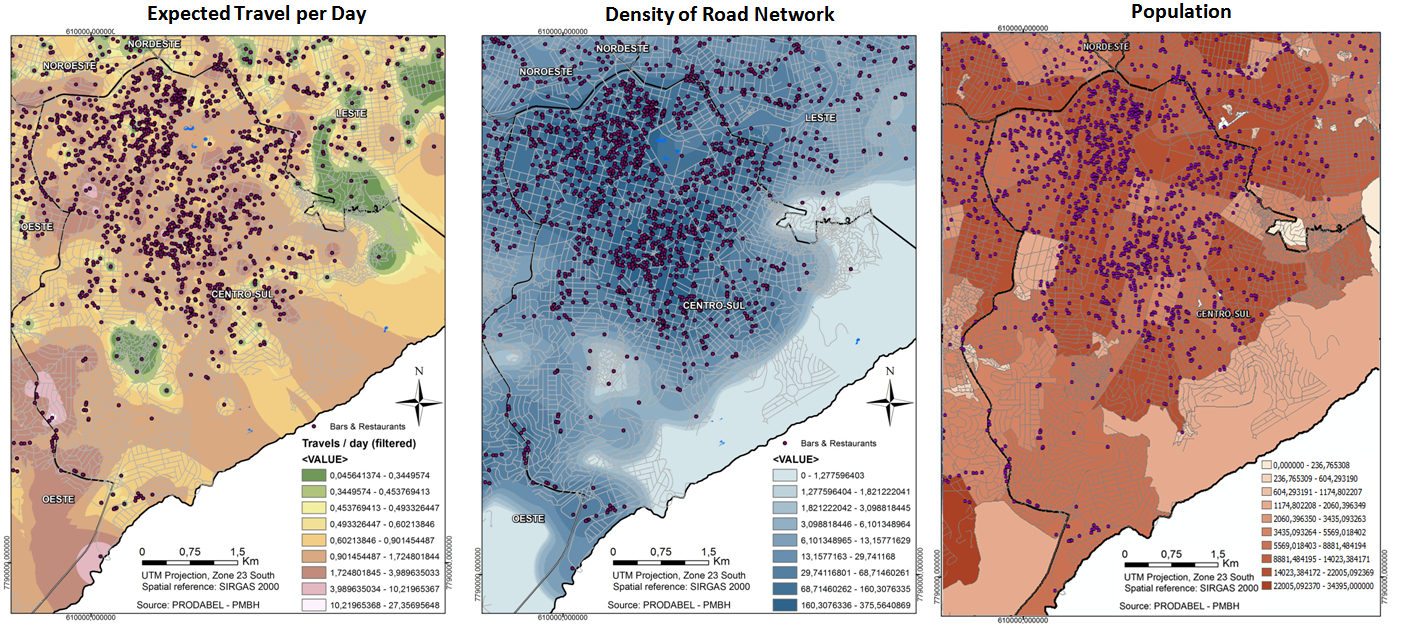
From the economic sustainability standpoint, there is an intrinsic relationship between population (consumers), foods and beverages (economic / social activity), mobility/accessibility to these services (existence of transportation infrastructure such as roads and public transportation) and the real demand for recharge supplies. The outputs of the model, when geographically spatialized and overlaid with other information provide an excellent perspective for supporting urban decision makers and policy makers.
5.3 Discussion of the results
The expected number of travels per day output from the model represents a realistic simulation of the current situation according to the survey from 2014. In order to better understand the results, the number of travels per day was loaded in a map containing the addresses of the establishments. This resulted in a punctual map (discrete information) that does not cover the whole area. Then, a geographic-based interpolation expanded the number of travels per day to a continuous surface as shown in Figures 5 and 6.
As shown in Figure 6, there is a geographic adherence between the number of travels per day, population and road density. The result indicates the need for an efficient urban freight policy to regulate the urban goods delivery towards meeting the demand of bars and restaurants.
As a recommendation, we draw attention to the importance of innovative ideas and alternative plans to lever positive changes in the urban transportation system to be presented and debated by specialists, authorities and the community. Holguín-Veras et al. (2016) suggest using forums and discussion groups to create a joint solution among the stakeholders involved in urban goods distribution. These measures highlight changes and can hopefully mobilize public managers, transportation managers and the population towards the continuous process of adaptation and improvement of public policies.
6 Conclusion
Regarding the development of this study, the key points are the characterization of an important economic sector of Belo Horizonte and especially the development of a freight trips generation model that is still an incipient theme in Brazil.
The model developed is mathematically robust and statistically acceptable. The model can be coupled to a GIS and provide results that support analysis in geographic contexts. We believe that the model can be used in the creation of public policies for Belo Horizonte: when we combine mathematical modeling with geographical analysis it is possible to understand the road occupancy impacts, and how and where the impacts will affect the population and economic sustainability of the region. These results can motivate the implementation of a less restrictive and more efficient public policy, to consolidate the goods and reduce the number of freight vehicles in urban areas.
The results of this study indicate differences between similar studies developed in Brazil. To do so, it demonstrates the necessity of the development of local models for freight demand management. Furthermore, the use of spatial analysis allows for the identification of potential sites for the implementation of this management policy, regarding the distances from main generators and attractors of freight trips.
References
Aditjandra PT, Galatioto F, Bell MC, Zunder TH (2016) Evaluating the impacts of urban freight traffic: Application of micro-simulation at a large establishment. European Journal of Transport and Infrastructure Research 16: 4–22
Allen Jr. WG (2002) Development of truck models. Report prepared for Baltimore Metropolitan Council, Baltimore, MD
Anand N, Quak H, van Duin R, Tavasszy L (2012) City logistics modeling efforts: Trends and gaps – A review. Procedia - Social and Behavioral Sciences 39: 101–115. CrossRef.
Bastida C, Holguín-Veras J (2009) Freight generation models: Comparative analysis of regression models and multiple classification analysis. Transportation Research Record 2097: 51–61. CrossRef.
Black WR (1999) Commodity flow modelling. Transportation research board. http://onlinepubs.trb.org/onlinepubs/circulars/ec011/black.pdf
Brogan JD (1979) Development of truck trip-generation rates by generalized land use categories. Transportation Research Record 716: 38–43
Cherrett T, Allen J, McLeod F, Maynard S, Hickford A, Browne M (2012) Understanding urban freight activity – key issues for freight planning. Journal of Transport Geography 24: 22–32. CrossRef.
Comi A, Delle Site P, Filippi F, Nuzzolo A (2012) Urban freight transport demand modelling: A state of the art. European Transport/Trasporti Europei 51: 1–17
Ducret R, Gonzalez-Feliu J (2016) Connecting demand estimation and spatial category models for urban freight: First attempt and research implications. Transportation Research Procedia 12: 142–156. CrossRef.
Gasparini A (2008) Attractiveness of freight trip generators in urban areas. Master thesis. IME, Brazil. [in Portuguese]
Gonzalez-Feliu J, Routhier JL (2012) Modeling urban goods movement: How to be oriented with so many approaches? Procedia - Social and Behavioral Sciences 39: 89–100. CrossRef.
Holguín-Veras J, Jaller M, Sànchez-Díaz I, Wojtowicz J, Campbell S, Levinson H, Lawson C, Powers EL, Tavasszy L (2012) Freight trip generation and land use. National cooperative freight research program – NCFRP report 19. http://onlinepubs.trb.org/onlinepubs/nchrp/nchrp_rpt_739.pdf, accessed on 11 June 2015
Holguín-Veras J, Sànchez-Díaz I, Browne M (2016) Freight demand management: Role in sustainable urban freight system. Transportation Research Procedia 12: 40–52. CrossRef.
Holguín-Veras J, Sànchez-Díaz I, Lawson CT, Jaller M, Campbell S, Levinson HS, H-S S (2013) Transferability of freight trip generation models. Transportation Research Record 2397: 1–8. CrossRef.
IBGE – Instituto Brasileiro de Geografia e Estatística (2010) Population census 2010. Instituto brasileiro de geografia e estatística
Iding MHE, Meester WJ, Tavasszy LA (2002) Freight trip generation by firms. 42nd European congress of the European Regional Science Association, Dortmund, Germany
ITE – Institute of Transportation Engineers (2008) Trip generation handbook, an ITE recommended practice. Institute of transportation engineers, Washington, DC
Kulpa T (2014) Freight truck trip generation modelling at regional level. Procedia - Social and Behavioral Sciences 111: 197–202. CrossRef.
Marra C (1999) Chaaracterization of urban goods movements. Master thesis, UNICAMP, Brazil. [in Portuguese]
Melo IBC (2002) Demand assessment for freight transport in urban areas. Master thesis, IME, Rio de Janeiro
Ogden KW (1992) Urban goods movement: A guide to policy and planning (1st ed.). Ashgate Publishing, Burlington, VT
Oliveira LK (2014) Diagnosis of loading and unloading spaces for urban freight distribution: a case study in Belo Horizonte. Journal of Transport Literature 8: 178–209. CrossRef.
Oliveira LK, Guerra ED (2014) A diagnosis methodology for urban goods distribution: A case study in Belo Horizonte City (Brazil). Procedia - Social and Behavioral Sciences 125: 199–211. CrossRef.
Oliveira LK, Santos OR, Nóbrega RAA, Dablanc L (2016) The geography of warehousing in Belo Horizonte (Brazil). 14th World conference on transport research – WCTR 2016, Shanghai
Priya C, Ramadurai G, Devi G (2015) Freight trip generation models for Chennai, India. TRB 94th annual meeting compendium of papers, Washington, USA
Shin H, Kawamura K (2005) Data need for truck trip generation analysis: Qualitative analysis of the survey of retail stores. Transport Chicago, Illinois Institute of Technology
Silva MR, Waisman J (2007) Urban freight: an exploratory study about freight truck generation in bars and restaurants. 16th Brazilian congress of transport and traffic, Maceio, Brazil. [in Portuguese]
Sànchez-Díaz I, Holguín-Veras J, Wang X (2016) An exploratory analysis of spatial effects on freight trip attraction. Transportation 43: 177–196. CrossRef.
Souza CDR, Silva SD, D’Agosto MA (2010) Freight trip generators in urban areas. Transportes 18: 46–57. [in Portuguese]
Tadi RR, Balbach P (1994) Truck trip generation characteristics of nonresidential land uses. ITE Journal 64: 43–47